Introduction
Last weekend -- 2020-03-20 ÷ 2020-03-22 -- I participated in the (Germany-centric) hackathon WirVsVirus. (I friend of mine who lives in Germany asked me to team up and sign up. Participated together with Balint Badonfai and Diego Zviovich.)
Our idea proposal was accepted, listed in the dedicated overview table (see item 806). The title of our hackathon project is:
“Geo-spatial-temporal Economic Model for COVID-19 Propagation and Management in Germany”
Nearly a dozen of people enlisted to help. (We communicated through Slack.)
WebImage["https://devpost.com/software/geo-raumlich-zeitliches-\
wirtschaftsmodell-fur-covid-19"]

Multiple people helped with the discussion of ideas, directions where to find data, with actual data gathering, and related documented analysis. Of course, just discussing the proposed solutions was already a great help!
What was accomplished
Work plans
The following mind-map reflects pretty well what was planned and done:
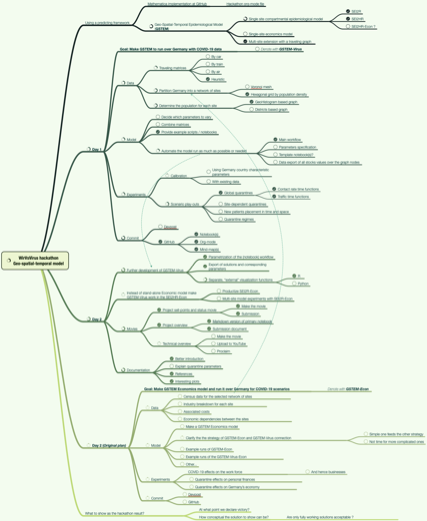
There is also a related org-mode file with the work plan.
Data
I obtained Germany city data with Mathematica’s build-in functions and used it to heuristically derive a traveling patterns graph, [AA1].
Here is the data:
dsCityRecords =
  ResourceFunction["ImportCSVToDataset"][
 "https://raw.githubusercontent.com/antononcube/SystemModeling/master/Data/dfGermanyCityRecords.csv"];
Dimensions[dsCityRecords]

(*{12538, 6}*)
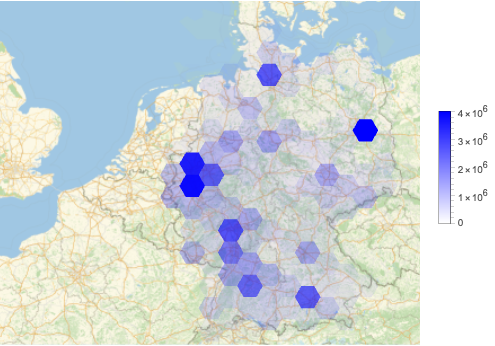
Here is Geo-histogram of that data:
cellRadius = Quantity[70, "Kilometers"];
aCoordsToPopulations = AssociationThread[Values /@ Normal[dsCityRecords[All, {"Lat", "Lon"}]], Normal[dsCityRecords[All, "Population"]]];
GeoHistogram[aCoordsToPopulations, cellRadius, ColorFunction -> (Opacity[#, Blue] &), PlotLegends -> Automatic]
We considered a fair amount of other data. But because of the time limitations of the hackathon we had to use only the one above.
Single-site models
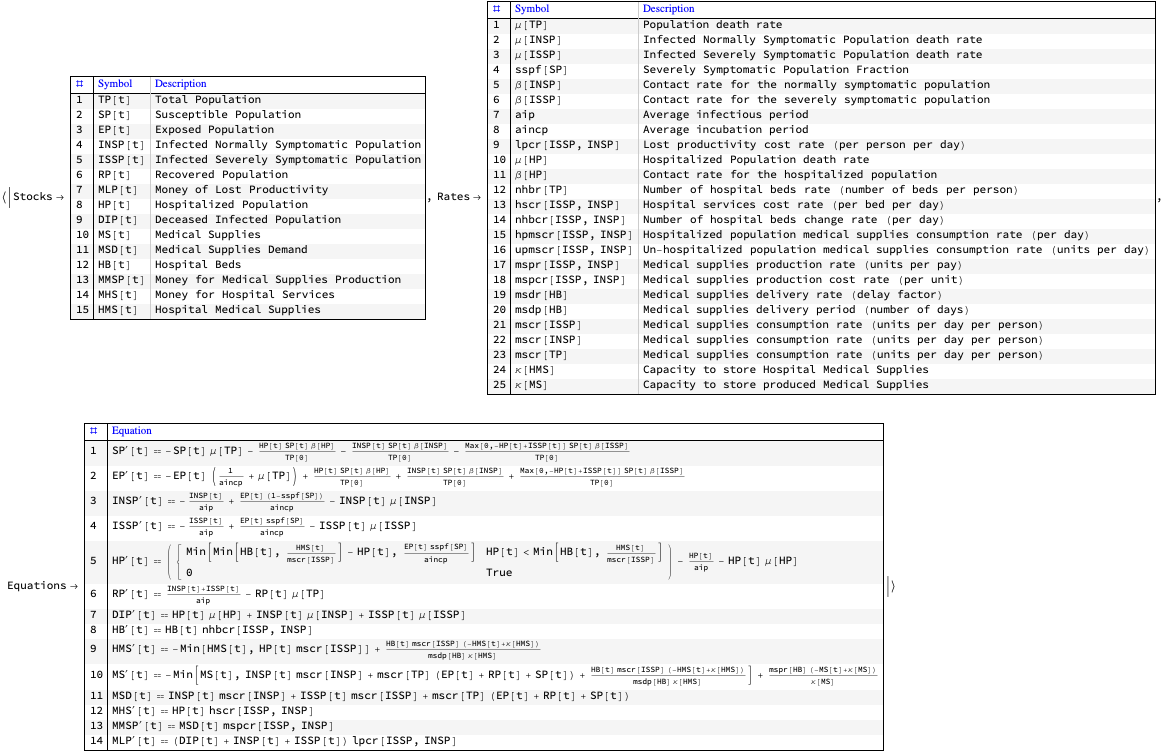
During the development phase I used the model SEI2R, but since we wanted to have a “geo-spatial-temporal epidemiological economics model” I productized the implementation of SEI2HR-Econ, [AAp1].
Here are the stocks, rates, and equations of SEI2HR-Econ:
Magnify[ModelGridTableForm[SEI2HREconModel[t]], 0.85]
Multi-site SEI2R (SEI2HR-Econ) over a hexagonal grid graph
I managed to follow through with a large part of the work plan for the hackathon and make multi-site scaled model that “follows the money”, [AA1]. Here is a diagram that shows the travelling patterns graph and solutions at one of the nodes:
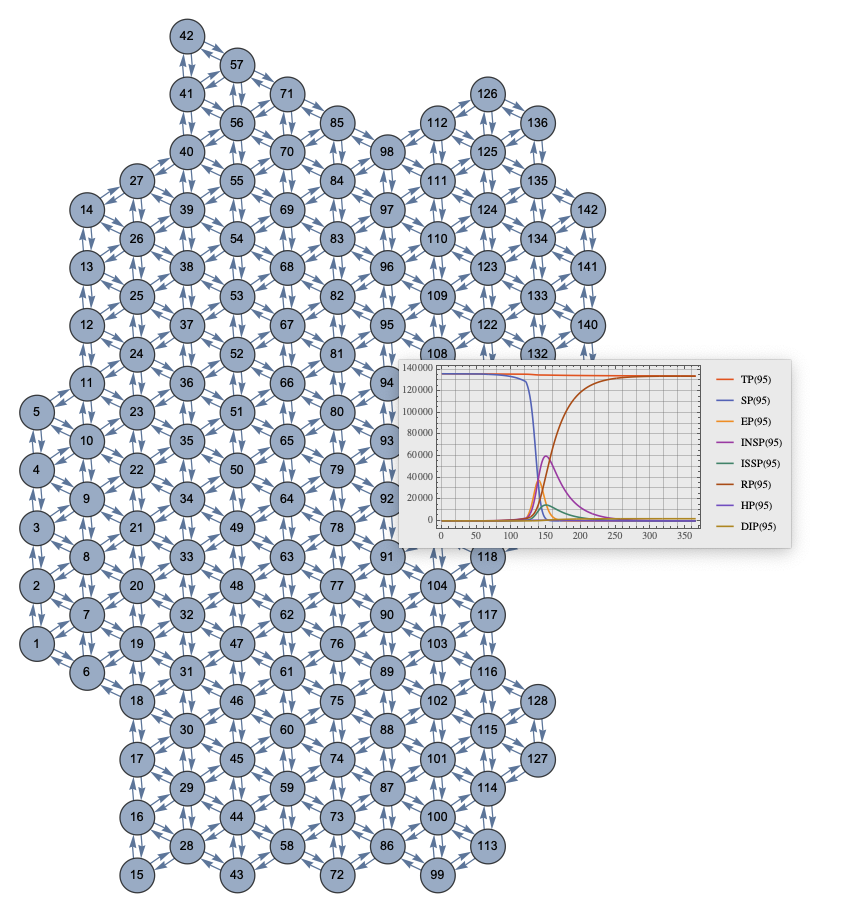
Here is an interactive interface for studying and investigating the solution results:
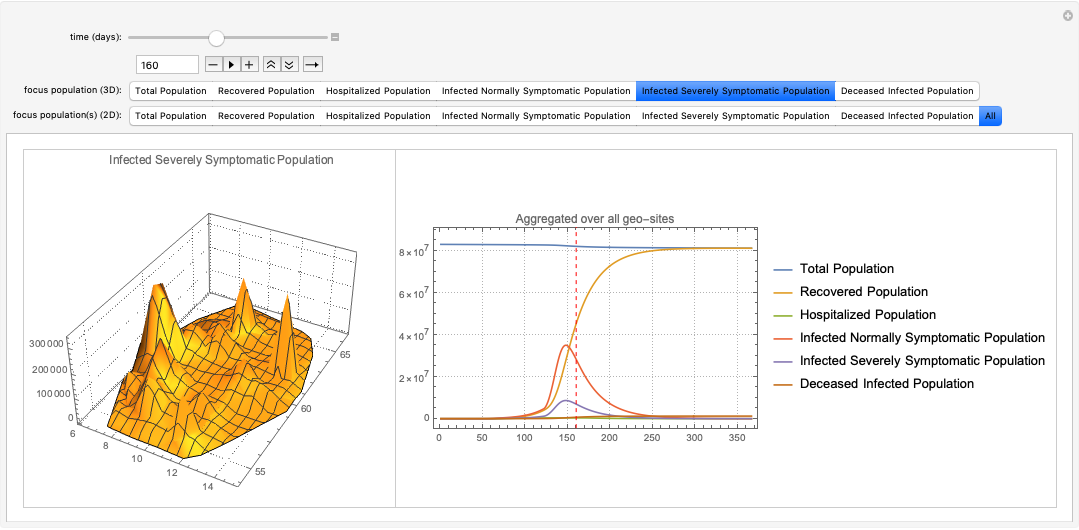
For more details see the notebook [AA1]. Different parameters can be set in the “Parameters” section. Especially of interest are the quarantine related parameters: start, duration, effect on contact rates and traffic patterns.
I also put simulations results code and programmed visualization routines in R, [AA2]. (In order other members of team to be able to explore the results.)
References
[DP1] 47wirtschaftliche AuswirkungGeo-spatial-temp-econ-modell, DevPost.
[WRI1] Wolfram Research, Inc., Germany city data records, (2020), SystemModeling at GitHub.
[AA1] Anton Antonov, "WirVsVirus hackathon multi-site SEI2R over a hexagonal grid graph", (2020), SystemModeling at GitHub.
[AA2] Anton Antonov, "WirVsVirus-Hackathon in R", (2020), SystemModeling at GitHub.
[AAp1] Anton Antonov, "Epidemiology models Mathematica package", (2020), SystemsModeling at GitHub.
 Attachments:


