Group Abstract Group Abstract

Message Boards Message Boards

WirVsVirus 2020 hackathon participation

Posted 5 years ago
Attachments:
POSTED BY: Anton Antonov
7 Replies

This post has been listed in the main resource-hub COVID-19 thread: https://wolfr.am/coronavirus in the section Computational Publications. Please feel free to add your own comment on that discussion pointing to this post ( https://community.wolfram.com/groups/-/m/t/1907256 ) so many more interested readers will become aware of your excellent work. Thank you for your contribution!

POSTED BY: EDITORIAL BOARD

enter image description here -- you have earned Featured Contributor Badge enter image description here

Your exceptional post has been selected for our editorial column Staff Picks http://wolfr.am/StaffPicks and Your Profile is now distinguished by a Featured Contributor Badge and is displayed on the Featured Contributor Board. Thank you!

POSTED BY: EDITORIAL BOARD

Thanks for finding out this! Fixed now.

I noticed that outlier, that is why in the computation notebook I have code that removes outliers.

POSTED BY: Anton Antonov

There is one type in the city csv file. Lline 7226 should read:

"Germany","RheinlandPalatinate","GemundenRheinlandPfalz",1080,50.558889, 8.017778

POSTED BY: Markus Roellig

Here is my naive attempt to ome up with informative tooltips:

Tooltips

Following the definitions from the Notebook

lsCells = 
      Cases[grHist[[1]], 
       Tooltip[h_Polygon /; MatrixQ[h[[1]]], 
         pop_ /; NumberQ[pop] && pop > 3] :> <|"Cell" -> h, 
         "Population" -> pop|>, \[Infinity]];
 lsCells = 
      Map[Append[#, "Center" -> Mean[PolygonCoordinates[#["Cell"]]]] &, 
       lsCells];

And extrakting the plot dimensions and scaling:

absOps = AbsoluteOptions[grHist[[1]]];

We now have to scale between Geographic coordinates

GeoRange /. absOps

(* {{47.0295, 55.4005}, {5.5195, 15.4305}} *)

and GeoGridPositions

GeoGridRange /. absOps

(* {{5.5195, 15.4305}, {53.4218, 66.8345}} *)

The idea is to select <numCities> largest cities from each bin (Polygon) and sow them together with their distance from the bin center. For this we need to scale between the coordinates and the geo grid used in the plot.

nlist = (Values /@ Normal[dsCityRecords]) /. {"Germany", b_, c_, d_, 
    e_, f_} :> {"Germany", b, c, d, Lon2X[f], Lat2Y[e]}

xyRange = GeoGridRange /. absOps
lonlatRange = Reverse[GeoRange /. absOps]
lonRescale[lon_] := Rescale[lon, xyRange[[1]], lonlatRange[[1]]]
latRescale[lon_] := Rescale[lon, xyRange[[2]], lonlatRange[[2]]]
rescaleLonLat[{lon_, lat_}] := {lonRescale[lon], latRescale[lat]}
X2Lon[x_] := Rescale[x, xyRange[[1]], lonlatRange[[1]]]
Y2Lat[y_] := Rescale[y, xyRange[[2]], lonlatRange[[2]]]
Lon2X[x_] := Rescale[x, lonlatRange[[1]], xyRange[[1]]]
Lat2Y[y_] := Rescale[y, lonlatRange[[2]], xyRange[[2]]]
LatLon2XY[{x_, y_}] := {Lon2X[y], Lat2Y[x]}

Let's create the tooltips

tooltip = Table[
   numCities = 5;
   rmf = RegionMember[lsCells[[i]]["Cell"]];
   sel = Select[nlist, rmf[#[[-2 ;; -1]]] &];
   len = Min[{Length[sel], numCities}];
   selTake = Take[sel, len];
   dist = 
    Round@GeoDistance[XY2LatLon[lsCells[[i]]["Center"]], 
        XY2LatLon[#[[-2 ;; -1]]]] & /@ selTake;
   If[sel != {},
    Panel[
     TableForm[
      Flatten /@ Transpose[{selTake[[All, {2, 3, 4}]], dist}], 
      TableHeadings -> {None, {"Federal State", "City", "Population", 
         "Distance to ctr."}}]],
    Panel[
     TableForm[{{"", "", "", ""}}, 
      TableHeadings -> {None, {"Federal State", "City", "Population", 
         "Distance to ctr."}}]]], {i, 1, Length[lsCells]}];

and put them in an Association for easier replacement later

ttasoc = Association@
   Table[{lsCells[[i]]["Population"] -> 
      Panel[tooltip[[i]], 
       Style[lsCells[[i]]["Population"], Red, Bold], Top]}, {i, 1, 
     Length[lsCells]}];

Now we can jst replace the Tooltip from the original figure:

grHist /. Tooltip[p_Polygon, pop_?NumberQ] :> Tooltip[p, ttasoc[pop]]

enter image description here

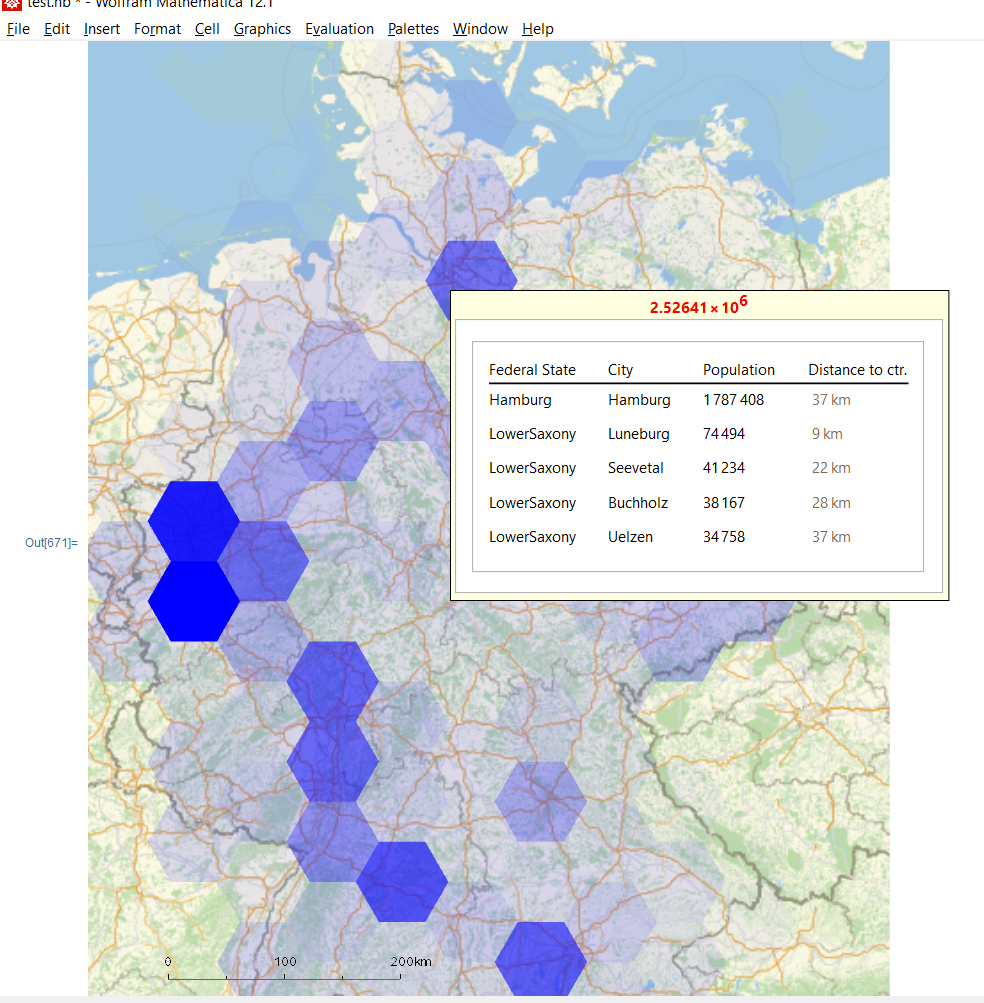
This is not perfect. If you move over the hexagon belonging to the Berlin area we note, that Berlin is not within the Polygon. enter image description here

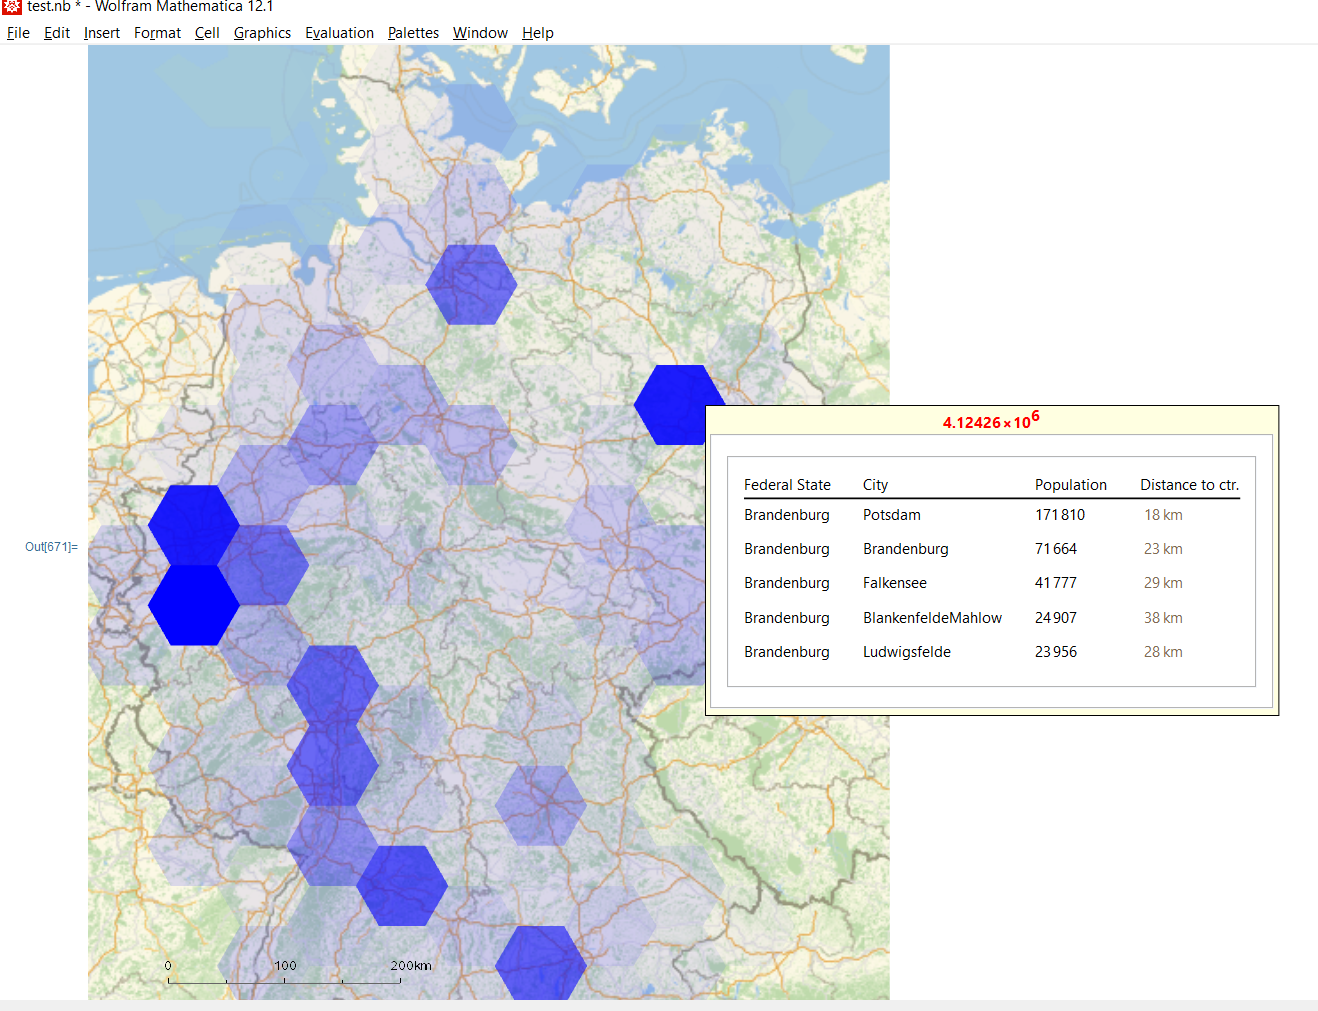
The reason is most likely my simple-minded rescaling of the geo positions but I couldn't figure out a better transformation. Maybe some GeoGraphics experts can help here

POSTED BY: Markus Roellig

Thanks for your comments, Markus!

we could add non-constant number of hospital beds. Do we have the data geometry-wise?

Yes, that is the most important "next task" in my opinion. And Germany's governmental sites provide very good, detailed information about hospital beds and workers. (One of our team members, who lives in Germany, demonstrated that to us.)

it would be nice to overlay the real-data on the individual cell predictions

Calibration is important, and it is a lot of work. At this point I want to make a better simulation tool, not (personally) spent that much time on calibration. Of course, with a better tool calibration and scenario play-out experiments are much easier.

tooltips with the area identifier (city/region/Landkreis) would be neat)

Ah, yes of course. That is in the next wave of work...

The animation shows a second wave of infected people. Is that because of a relaxation in quarantine/travel bans?

I think the second wave in the animation is "an illusion" -- when I plot the individual animation slides the second wave is not seen. (The animation in the notebook is done by-vertex normalization, just to demonstrate model's spatial propagation simulation abilities.)

POSTED BY: Anton Antonov

Absolute amazing work! Thanks for sharing. The animation shows a second wave of infected people. Is that because of a relaxation in quaratine/travel bans?

Ideas:

  • we could add non-constant number of hospital beds. Do we have the data geometry-wise?
  • it would be nice to overlay the real-data on the individual cell predictions
  • tooltips with the area identifier (city/region/Landkreis) would be neat)
POSTED BY: Markus Roellig
Reply to this discussion
Community posts can be styled and formatted using the Markdown syntax.
Reply Preview
Attachments
Remove
or Discard