Hi,
the following lines of code might help.
names = RandomChoice[FinancialData["^DJI", "Members"], 10]
u = FinancialData[#, "Price", {{2000}, {2010}, "Day"}][[All, 2]] & /@ names;
The first one gets the names of 10 DowJones companies. The second one downloads share prices for them. The resulting variable u has the format you want.
u[[1,5]]
gives the value of share of the first company at time 5. It is easy to find out the shortest of the time series by:
mlength = Min[Table[Length[u[[k, All]]], {k, 1, 10}]]
Now we might calculate the matrix of all covariances:
covtable =
Table[Covariance[u[[i, 1 ;; mlength]], u[[j, 1 ;; mlength]]], {i, 1, Length[names]}, {j, 1, Length[names]}];
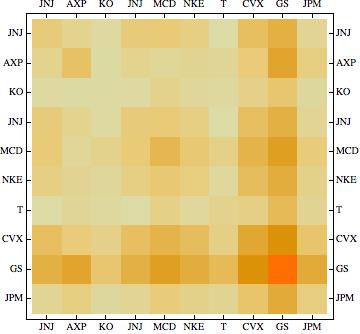
A little plot helps to visualise the result
Show[MatrixPlot[covtable], FrameTicks -> {Table[ {i - 0.5, ToString[names[[i]]]}, {i, 1, Length[names]}], Table[ {i - 0.5, ToString[names[[-i]]]}, {i, 1, Length[names]}]}]
which gives

I hope that this helps.
Cheers,
M.