Message Boards Message Boards

0
|
5399 Views
|
2 Replies
|
0 Total Likes
View groups...
Share
Share this post:

Can Mathematica import real raw data for a calculation and assign them?

Posted 11 years ago
Hi. May I ask whether Mathematica can import real world raw data like asset prices of the firm to compute the covariance of the asset prices, or the volatility of the portfolio of the asset prices?

In addition, is there a way that I can assign the real raw data like asset prices to each vectors such as
u[1,1], u[1,2], and so on? Here, u[i,t] is the asset price of unit "i" at time "t".

Thank you very much!
POSTED BY: Woo Young Kang
2 Replies
Mathematica is a full programming language. So yes, it can do all of this. 

You might be able to get the assest prices using the FinancialData function or from Wolfram|Alpha. If not, then you will need to find a source of the data in an appropiate file format to import it.  

Yes you can assign values to symbols in Mathematica. How to do this all very much depends on what the structure of the data you are importing is. 

Before doing all of this, you may want to cover some of the basics of programming in Mathematica using the Mathematica virtual book :

http://reference.wolfram.com/mathematica/howto/UseTheVirtualBook.html
POSTED BY: Sean Clarke
Hi,

the following lines of code might help.
names = RandomChoice[FinancialData["^DJI", "Members"], 10]
u = FinancialData[#, "Price", {{2000}, {2010}, "Day"}][[All, 2]] & /@ names;

The first one gets the names of 10 DowJones companies. The second one downloads share prices for them. The resulting variable u has the format you want.
u[[1,5]]

gives the value of share of the first company at time 5. It is easy to find out the shortest of the time series by:
mlength = Min[Table[Length[u[[k, All]]], {k, 1, 10}]]

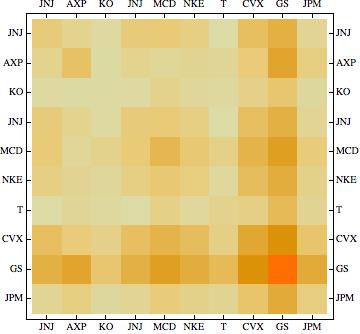
Now we might calculate the matrix of all covariances:
covtable =
Table[Covariance[u[[i, 1 ;; mlength]], u[[j, 1 ;; mlength]]], {i, 1, Length[names]}, {j, 1, Length[names]}];

A little plot helps to visualise the result
Show[MatrixPlot[covtable], FrameTicks -> {Table[ {i - 0.5, ToString[names[[i]]]}, {i, 1, Length[names]}], Table[ {i - 0.5, ToString[names[[-i]]]}, {i, 1, Length[names]}]}]
which gives


I hope that this helps.

Cheers,
M.
POSTED BY: Marco Thiel
Reply to this discussion
Community posts can be styled and formatted using the Markdown syntax.
Reply Preview
Attachments
Remove
or Discard

Group Abstract Group Abstract