Dear Michelle,
thank you for the matrix. Here are some comments. I first save the matrix
matrix = {{0, 1, 0, 0, 0, 0, 1, 0}, {0, 0, 0, 0, 0, 1, 1, 0}, {0, 1,
0, 0, 1, 0, 0, 0}, {1, 0, 1, 0, 0, 0, 1, 1}, {0, 0, 0, 0, 0, 1, 0,
1}, {1, 0, 0, 0, 0, 0, 0, 1}, {0, 0, 0, 1, 1, 1, 0, 0}, {0, 1, 0,
0, 0, 0, 1, 0}}
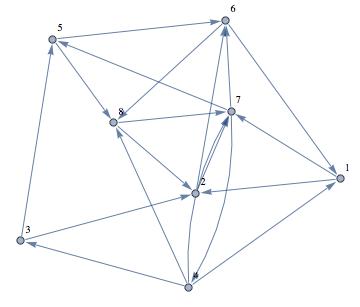
I then plot it.
AdjacencyGraph[matrix, VertexLabels -> "Name", ImagePadding -> 10]
Looks nice:
Next I calculate the eigenvalues - strictly speaking this is not necessary for your problem.
Eigenvalues[matrix] // N
This gives
{2.3728, -0.680664 + 1.64275 I, -0.680664 - 1.64275 I, -1.23221,
0.295924 + 0.70383 I, 0.295924 - 0.70383 I, -0.371109, 0.}
The normalised eigenvector to the largest (first) eigenvalue is obtained by
Normalize[Part[Eigenvectors[matrix] // N, 1]]
Now that gives the desired result
{0.31902, 0.304159, 0.232608, 0.557762, 0.247773, 0.268897, 0.452812, 0.31902}
which are the relative times to spend at the different nodes.
If we normalise the sum to 1, we obtain the percentage of the time that a random walker would spend at a given node.
Part[Eigenvectors[matrix] // N, 1] / Total[Part[Eigenvectors[matrix] // N, 1]]
This gives
{0.118066, 0.112566, 0.0860857, 0.206422, 0.0916982, 0.0995159, 0.167581, 0.118066}
So about 12% of the time the random walker is at node one etc.
Just to check the result, let's use the power algorithm to determine the eigenvector. I define an arbitrary starting vector:
vecstart = Table[1., {i, 1, Length[matrix]}]
(*{1., 1., 1., 1., 1., 1., 1., 1.}*)
I then apply the matrix to the vector and iterate...say 100 times:
Nest[Normalize[matrix.#] & , vecstart, 100]
The result is
{0.31902, 0.304159, 0.232608, 0.557762, 0.247773, 0.268897, 0.452812, 0.31902}
which is identical to the one above. Normalising this to 1 in the numerically most clumsy way
Nest[Normalize[matrix.#] & , vecstart, 100]/Total[Nest[Normalize[matrix.#] & , vecstart, 100]]
gives the relative times spent at the nodes
{0.118066, 0.112566, 0.0860857, 0.206422, 0.0916982, 0.0995159, 0.167581, 0.118066}
I hope that this helps. Note that it does not take the probabilities that you gave into consideration.
M.


