Message Boards Message Boards

0
|
6945 Views
|
20 Replies
|
8 Total Likes
View groups...
Share
Share this post:

How to write Mathematica for this statistical model?

Posted 11 years ago
One mathematical model of web surfing is given by starting at a
random web site. Then, with 85% probability, the next page visited is selected
randomly from pages linked to the current page. With 15% probability, the
next page is selected randomly from all webpages.
Consider, for example, the "mini" web of pages pictured below. If a surfer
is at page 4, there's an 85% chance the surfer will follow a link to page 1, 3, 5,
or 8 (each with equal probability), and a 15% chance the surfer will go to page
1, 2, 3, 4, 5, 6, 7, or 8 (again, each with equal probability)
POSTED BY: michelle yrw
20 Replies
You've described a Discrete Markov Process. Mathematica 9 has a function specifically for these: 

http://reference.wolfram.com/mathematica/ref/DiscreteMarkovProcess.html
POSTED BY: Sean Clarke
Dear Michelle,

you might want to try this code:
 ClearAll["Global`*"]
 
 (*length of the random walk*)
 M = 20;
 
 style = {VertexStyle -> White, VertexShapeFunction -> "Point",
    EdgeStyle -> Directive[Opacity[.5], Hue[.15, .5, .8]],
    Background -> Black, EdgeShapeFunction -> (Line[#1] &),
    ImageSize -> 500};

(*We start at the BBC new website*)

walk = {"http://www.bbc.co.uk/news/"}; For[i = 1, i <= M, i++,
string = RandomChoice [Import[#, "Hyperlinks"]] & @ Last[walk];
If[UnsameQ[string, RandomChoice[{}]], AppendTo[walk, string]]]

Table[walk[[i]] -> walk[[i + 1]], {i, 1, Length[walk] - 1}];

Graph[Table[walk[[i]] -> walk[[i + 1]], {i, 1, Length[walk] - 1}], style]

A standard output would be:


There are lots of obvious ways to improve this. Also it does not include the 15% probability to jump to a random website yet, but that is straight forward to program into it.

You can for example use
http://www.randomwebsite.com/cgi-bin/random.pl
and jump to where that redirects to get a new fresh starting site for your random walk.

Cheers,
M.
POSTED BY: Marco Thiel
You could write a Monte-Carlo algorithm to compute this. Doing this would probably first require learning more about the basics of programming Mathematica.

In the case of a well Markov Process, there's no need to resort to using a Monte-Carlo approximation to get this information. You can use the MarkovProcessProperties function to calculate the Mean Holding Time of each state. 

MarkovProcessProperties has a property called "HoldingTimeMean" which might be helpful. 
POSTED BY: Sean Clarke
There is also a quite nice book on this: "A Course on the Web Graph" by Anthony Bonato published by the American Mathematical Society. Many of the ideas in that book can be efficiently implemented in Mathematica. 

Actually, there are page ranking methods which aare based on this kind of thing, i.e. HITS (hyperlink-induced topic search), the well known page rank, and SALSA (Stochastic Approach for Link Structure Analysis). PageRank is sort of the stationary distribution of a random walk on a digraph; it represents the probability that a random surfer visits the page. The algorithm is just as you describe, i.e. a random walk with some probability of jumping to a completely unrelated page. 

On page 107 of "A Course on the Web Graph" you find a theorem that shows how the dominant eigenvector s, i.e. the one with eigenvalue 1, of the (suitably defined) transition matrix, is crucial here. The PageRank Markov Chain converges to a stationary distribution equalling s. 
Once the transition matrix is known it is, in theory, straight forward to calculate the dominant eigenvector with Mathematica.

Of ocurse there are the obvious limits for extremely large graphs. Mathematica estimates the number of websites 
==  estimated number of indexed web pages
to be roughly 10.82 billion as of May 2012. I suppose that in order to calculate the dominant eigenvector for the "entire network" there are substantial numerical difficulties on standard computer systems, even if we use sparse matrices. It appears that Google use the power iteration scheme to calculate the page rank; this takes a week or so of intensive calculations on quite powerful computer systems. There are algorithms based on Monte Carlo approaches which converge quite quickly and can be easily parallelised:
http://www-sop.inria.fr/members/Konstantin.Avratchenkov/pubs/mc.pdf

Cheers,
M.

NB: The google toolbar allows you to see the PageRank of any given website:
https://support.google.com/toolbar/answer/79837?hl=en-GB
POSTED BY: Marco Thiel
Well, my name is not Vote 1, but let me try to amend the code. :-)

I have somewhat improved the code, but it still runs frequently into problems, i.e. it uses links to sign up for accounts and then there "is no way out". Anyway, the following piece of code is somewhat more reliable than the first bit. The odds are that it does not "survive" a random walk of length 100, but you can easily use the intermediate results.

I borrowed two functions from this beautiful demonstrations project:
http://reference.wolfram.com/mathematica/example/StructureOfTheWeb.html

Here it comes:
 ClearAll["Global`*"]
 
 M = 100;
 
 webcrawler[rooturl_, depth_] :=
   Flatten[Rest[
     NestList[
      Union[Flatten[
         Thread[# -> Import[#, "Hyperlinks"]] & /@
         Last /@ #]] &, {"" -> rooturl}, depth]]];

style = {VertexStyle -> White, VertexShapeFunction -> "Point",
   EdgeStyle -> Directive[Opacity[.5], Hue[.15, .5, .8]],
   Background -> Black, EdgeShapeFunction -> (Line[#1] &),
   ImageSize -> 500};

walk = {"http://www.wolfram.com"};
Monitor[
For[i = 1, i < M, i++,
  AppendTo[walk,
   Quiet[RandomChoice[
      Select[webcrawler[walk[[-1]], 1],
       StringFreeQ[
         ToString[#], {___ ~~ "Failed" ~~ ___, ___ ~~ "pdf", ___ ~~
           "PDF", "mailto" ~~ ___, ___ ~~ "jpg", ___ ~~
           "JPG"} ] &]][[2]]]];
  DeleteCases[walk, HoldPattern[RandomChoice[{}][[2]]]]], i]

Graph[Union[
  Table[UndirectedEdge[Sort[{walk[[i]], walk[[i + 1]]}][[1]],
    Sort[{walk[[i]], walk[[i + 1]]}][[2]]], {i, 1,
    Length[walk] - 1}]], style]

You will see that I created a kind of exclusion list with the command StringFreeQ. If I wanted to make the program more reliable, I would have to exclude further formats, such as gif etc. 


This piece of code is far from fully functional and very slow, but it might still serve as a starting point. Also, this random walk is unsupervised; as the walks get longer, you might end up at improper websites. This might be quite a problem! Depending on the legislation in your country and the policies of your work place you might actually get into trouble, by accessing illegal content. 

There is a 15 year old Nature article 
http://www.nature.com/nature/journal/v401/n6749/full/401130a0.html
that might be relevant.

That estimates the "diameter of the web", i.e. the shortest distance between any two points in the network. It claims that randomly chosen webpages are on average 19 clicks or so away. Now the web is a bit larger, but the average path length between any two pages won't have changed a lot. Given the amount of dubious websites, this might suggest that performing a random walk, there is a relatively high probability that inadvertently you end up at very nasty pages. 

Cheers,
M.
POSTED BY: Marco Thiel
Posted 11 years ago
Re:

Your link http://reference.wolfram.com/mathematica/example/StructureOfTheWeb.html

is really beautiful. Marvelous!
POSTED BY: michelle yrw
Dear Michelle,

thank you for the matrix. Here are some comments. I first save the matrix
matrix = {{0, 1, 0, 0, 0, 0, 1, 0}, {0, 0, 0, 0, 0, 1, 1, 0}, {0, 1,
   0, 0, 1, 0, 0, 0}, {1, 0, 1, 0, 0, 0, 1, 1}, {0, 0, 0, 0, 0, 1, 0,
   1}, {1, 0, 0, 0, 0, 0, 0, 1}, {0, 0, 0, 1, 1, 1, 0, 0}, {0, 1, 0,
   0, 0, 0, 1, 0}}

I then plot it.
AdjacencyGraph[matrix, VertexLabels -> "Name", ImagePadding -> 10]
Looks nice:
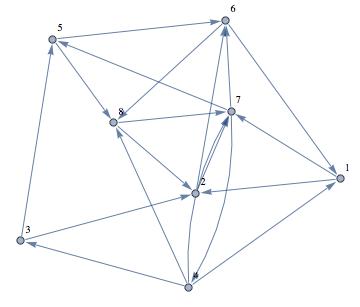

Next I calculate the eigenvalues - strictly speaking this is not necessary for your problem.
Eigenvalues[matrix] // N
This gives
{2.3728, -0.680664 + 1.64275 I, -0.680664 - 1.64275 I, -1.23221,
0.295924 + 0.70383 I, 0.295924 - 0.70383 I, -0.371109, 0.}

The normalised eigenvector to the largest (first) eigenvalue is obtained by
Normalize[Part[Eigenvectors[matrix] // N, 1]]

Now that gives the desired result
{0.31902, 0.304159, 0.232608, 0.557762, 0.247773, 0.268897, 0.452812, 0.31902}
which are the relative times to spend at the different nodes.

If we normalise the sum to 1, we obtain the percentage of the time that a random walker would spend at a given node.
Part[Eigenvectors[matrix] // N, 1] / Total[Part[Eigenvectors[matrix] // N, 1]]

This gives
{0.118066, 0.112566, 0.0860857, 0.206422, 0.0916982, 0.0995159, 0.167581, 0.118066}
So about 12% of the time the random walker is at node one etc.
Just to check the result, let's use the power algorithm to determine the eigenvector. I define an arbitrary starting vector:
vecstart = Table[1., {i, 1, Length[matrix]}]
(*{1., 1., 1., 1., 1., 1., 1., 1.}*)
I then apply the matrix to the vector and iterate...say 100 times:
Nest[Normalize[matrix.#] & , vecstart, 100]
The result is 
{0.31902, 0.304159, 0.232608, 0.557762, 0.247773, 0.268897, 0.452812, 0.31902}
which is identical to the one above. Normalising this to 1 in the numerically most clumsy way
Nest[Normalize[matrix.#] & , vecstart, 100]/Total[Nest[Normalize[matrix.#] & , vecstart, 100]]
gives the relative times spent at the nodes
{0.118066, 0.112566, 0.0860857, 0.206422, 0.0916982, 0.0995159, 0.167581, 0.118066}
I hope that this helps. Note that it does not take the probabilities that you gave into consideration. 

M.
POSTED BY: Marco Thiel
Regarding the probabilities do you mean this:
probmatrix = Table[matrix[[k]] /. {0 -> 0.15/Sort[Tally[matrix[[k]]]][[1, 2]], 1 -> 0.85/Sort[Tally[matrix[[k]]]][[2, 2]]} , {k, 1, Length[matrix]}] // MatrixForm
In that case the eigenvector for the largest eigenvalue (which is one!; probability matrix) is:
Eigenvectors[probmatrix][[1]]/Total[Eigenvectors[probmatrix][[1]]]
which gives
{0.125, 0.125, 0.125, 0.125, 0.125, 0.125, 0.125, 0.125}
Cheers,
M.
POSTED BY: Marco Thiel
Posted 11 years ago
Many thanks, I will take a look. Cheers.
POSTED BY: michelle yrw
Posted 11 years ago
Actually, can we use the

Monte Carlo Simulation to determine the percentage of time a user spends at each of the eight sites ? Thanks.
POSTED BY: michelle yrw
Posted 11 years ago
Thanks for all of you above. Very helpful. See you for other questions.
POSTED BY: michelle yrw
Posted 11 years ago
To: Vote 1,

When I use your code, I got something like

Graph::supp: Mixed graphs and multigraphs are not supported. >>

I couldn't figure out where the something I have to fix.

Thanks
POSTED BY: michelle yrw
Posted 11 years ago
Hi, Here is the code I have, what do you think about this one?

The idea:

1. Create a function that takes in a number of iterations to run for.
2. Use the "Module to create a list of variables you'll need to use in the function. One of these must be a counter to keep track of how many times you've hit each website.


rankwebsite[n_] :=
Module[{a, b, c, list, count = {0, 0, 0, 0, 0, 0, 0, 0}},
 
  (*3. Create a list that represents the network inside the function*)
\

 
  list = {};
  
   (*4. Generate a website to start with using the RandomInteger \
function*)
  
   a = RandomInteger[{1, 8}];
  
   (*5. Increase the counter for that website in your count by 1*)
  
   count[] = count[] + 1;
  
   (*6. Create a for loop to go through the iterations*)
  
   For[i = 1, i <= n, i++,
   
    (*7. Create another RandomInteger to store the probability*)
   
    b = RandomInteger[{1, 100}];
   
    (*8. If the probability is from 85-100,
    you  want to go to another random website,
    so you reset your initial variable,a,
    and increase its counter by 1 as before. Otherwise,
    go to a website linked to the website you're currently on*)
   
    If[b > 85,
    
     a = RandomInteger[{1, 8}];
     count[] count[] + 1;,
    
     c = RandomInteger[]; (*Access a number for the linked website \
you will now go to*)
     a = list[][];
     count[] = count[] + 1; (*Increase counter again*)
     ];
   
    ];
  
   (*Now all you have to do is print out the websites in such a way \
that you see the rankings clearly*)
  
   ;]
POSTED BY: michelle yrw
Posted 11 years ago
I just ran exactly your code (copy and paste), but it came out a straight line with a circle. Is it strange?
POSTED BY: michelle yrw
Posted 11 years ago
Hi, all,

I am newer for the code.

This question asks " Use Monte Carlo Simulation to determine the percentage of time a user spends at each of the eight sites in the mini-web "

Where I can see the percentage?
POSTED BY: michelle yrw
Posted 11 years ago
Do you have your email address, so I can sent the real question to you. SInce I still confuse something and I don't know how to load the pdf picture in the quesion here.
POSTED BY: michelle yrw
Posted 11 years ago
When I increase m to 1000, I got a beautiful picture.
POSTED BY: michelle yrw
Dear Michelle,

I just ran exactly your code (copy and paste), but it came out a straight line with a circle. Is it strange?
No, that is not surprising. After all, we are performing a random walk on the network. Everytime you run it it will give you a different sequence of websites.

This question asks " Use Monte Carlo Simulation to determine the percentage of time a user spends at each of the eight sites in the mini-web "

I am not sure what mini-web you are referring to; can you upload the figure? If you are given a simple (toy) network, you would proceed as Sean Clarke has suggested. You would use Markov. So probably you want to find the eigenvector to the dominant eigenvalue. The values of the components of the vector will give you the relative times spent on the websites.

M.
POSTED BY: Marco Thiel
Posted 11 years ago
Hi, all,

I have the following matrix.
{0, 1, 0, 0, 0, 0, 1, 0},
{0, 0, 0, 0, 0, 1, 1, 0},
{0, 1, 0, 0, 1, 0, 0, 0},
{1, 0, 1, 0, 0, 0, 1, 1},
{0, 0, 0, 0, 0, 1, 0, 1},
{1, 0, 0, 0, 0, 0, 0, 1},
{0, 0, 0, 1, 1, 1, 0, 0},
{0, 1, 0, 0, 0, 0, 1, 0}
 

For each i I have the probability for each "1" in the matrix, I have the probability 0.85 divided the no. of 1 in the row. Fox example, for the first each "1" is 0.85/2
for the second row is 0.85/2, but for the forth row, the probability is 0.85/4. and for each 0, I have the 0.15 / (how many 0 in the row), for the first row, the Probability is .15/6.

How I can use Array to insert the all probability correctly in the matrix? ASAP thanks
POSTED BY: michelle yrw
Posted 11 years ago
Great, I will test it.

That is the graph for the website, now you got it.

I have another challenge problem for you later.

Nice. I will study on it now.
POSTED BY: michelle yrw
Reply to this discussion
Community posts can be styled and formatted using the Markdown syntax.
Reply Preview
Attachments
Remove
or Discard

Group Abstract Group Abstract