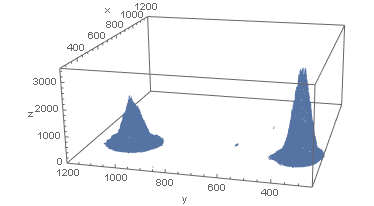
It appears that you want to fit two very separated surfaces with each surface being proportional in height to a bivariate normal distribution. (You're not fitting a probability distribution but rather just using some functions that happen to be proportional to probability distributions.)
First import the data and follow @Updating Name 's advice by restructuring the data:
data = Import["40MHz_0001.ascii.csv", "Data"];
data = Flatten[Table[{i, j, data[[i, j]]}, {i, 1448}, {j, 1929}], 1];
Then (after I snooped a bit at your data) plot the data:
d = Select[data, #[[3]] > 100 &];
ListPointPlot3D[d, PlotRange -> {{250, 1200}, {250, 1200}, {0, 3500}}, AxesLabel -> {"x", "y", "z"}]

Now isolate each peak and use NonlinearModelFit:
data1 = Select[data, 300 < #[[1]] < 650 && 200 < #[[2]] < 500 &];
nlm1 = NonlinearModelFit[data1, {a01 +
  a1 10^7 PDF[BinormalDistribution[{\[Mu]x1, \[Mu]y1}, {\[Sigma]x1, \[Sigma]y1}, \[Rho]1], {x, y}], a1 > 0},
   {{a01, 35}, {a1, 2}, {\[Mu]x1, 500}, {\[Mu]y1, 350}, {\[Sigma]x1, 35}, {\[Sigma]y1, 35}, {\[Rho]1, 0}}, {x, y}];
nlm1["BestFitParameters"]
(* {a01 -> 61.5589, a1 -> 1.99095, \[Mu]x1 -> 500.052, \[Mu]y1 -> 331.408, \[Sigma]x1 ->
  34.539,
  \[Sigma]y1 -> 30.2634, \[Rho]1 -> -0.107371} *)

data2 = Select[data, 350 < #[[1]] < 600 && 800 < #[[2]] < 1200 &];
ListPlot[Select[data2, #[[3]] > 100 &][[All, {1, 2}]]]
nlm2 = NonlinearModelFit[data2, {a02 +
     a2 10^7 PDF[BinormalDistribution[{\[Mu]x2, \[Mu]y2}, {\[Sigma]x2, \[Sigma]y2}, \[Rho]2], {x, y}], a2 > 0},
   {{a02, 35}, {a2, 1.5}, {\[Mu]x2, 500}, {\[Mu]y2, 1000}, {\[Sigma]x2, 40}, {\[Sigma]y2, 40}, {\[Rho]2, 0}}, {x, y}];
nlm2["BestFitParameters"]
(* {a02 -> 62.7361, a2 -> 1.3379, \[Mu]x2 -> 488.807, \[Mu]y2 -> 1015.64, \[Sigma]x2 ->
  37.3867,
  \[Sigma]y2 -> 38.2114, \[Rho]2 -> -0.0203793} *)