MODERATOR NOTE: this work is now a resource function: https://resources.wolframcloud.com/FunctionRepository/resources/DigitalCirclism/
full code and functions' definitions can be found in the attached notebook at the end of the post.
Introduction
Let' s see how to generate pictures like:
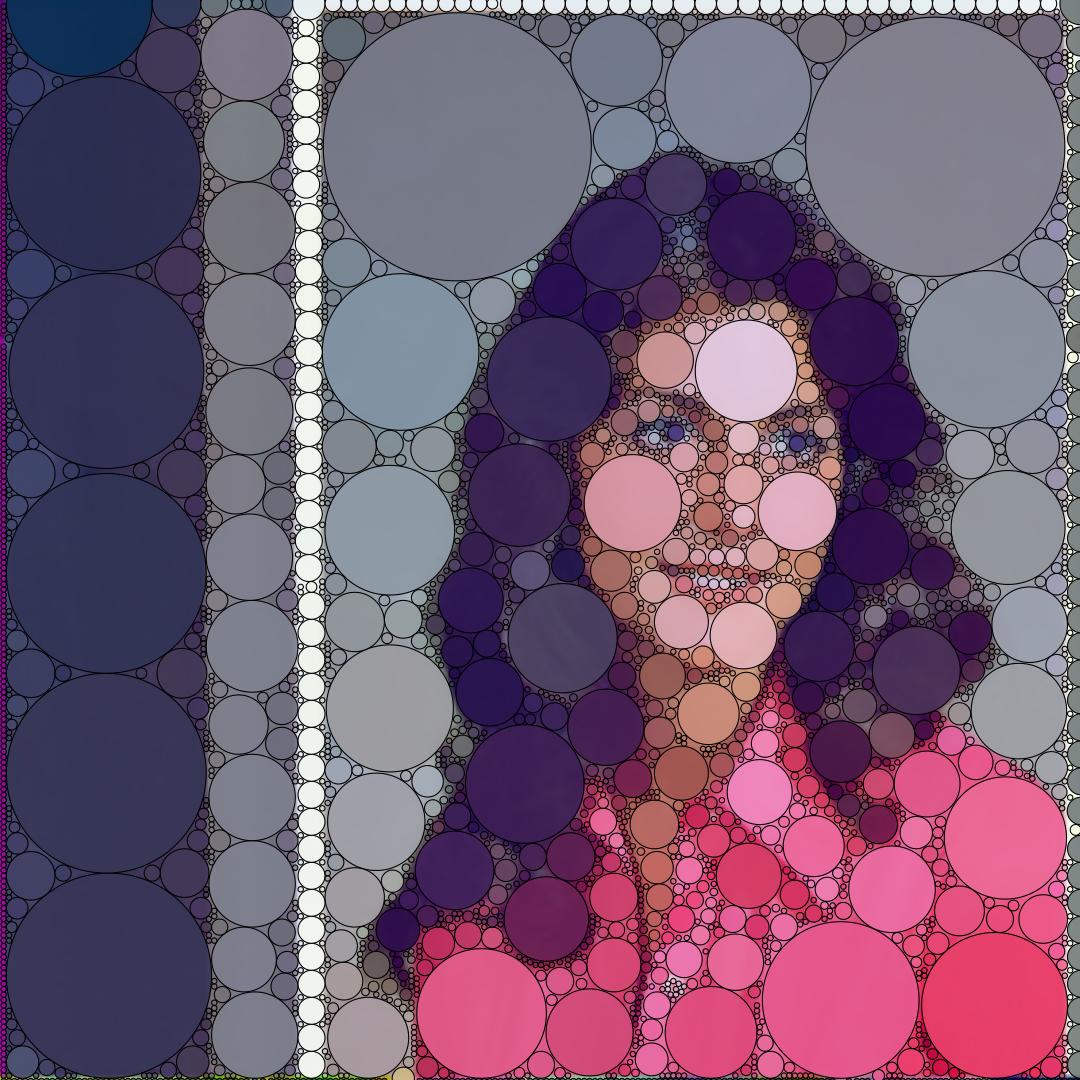
Initially, I got the idea from this site:
https://github.com/arihant-001/Circlism
But, I was not able to reproduce the results and my first algorithm was too slow. Then, I discovered this very interesting discussion:
https://mathematica.stackexchange.com/questions/40334/generating-visually-pleasing-circle-packs
But, it was not exactly like the first link.
After some experiments, and by mixing the ideas from the 2 previous links and some ideas of mine, I was able to generate the kind of pictures I wanted.
Preprocessing
First, we need to extract the edges of the picture. I have found that the following steps are generally giving a good result.
I am resizing the image so that it is not too big. Otherwise the algorithm will be very slow. There are some optimizations I could do.
srcImage =
 ColorConvert[
  ImageResize[
   RemoveAlphaChannel[ExampleData[{"TestImage", "Girl3"}], White],
   400], "RGB"]
I am applying a MeanShiftFilter. But you could try with other processing to reduce the noise. There is no rule. It just has to look good at the end.
segmented = MeanShiftFilter[srcImage, 13, 0.1]

Finally, the edges are computed.
edges = ColorNegate@EdgeDetect[segmented]
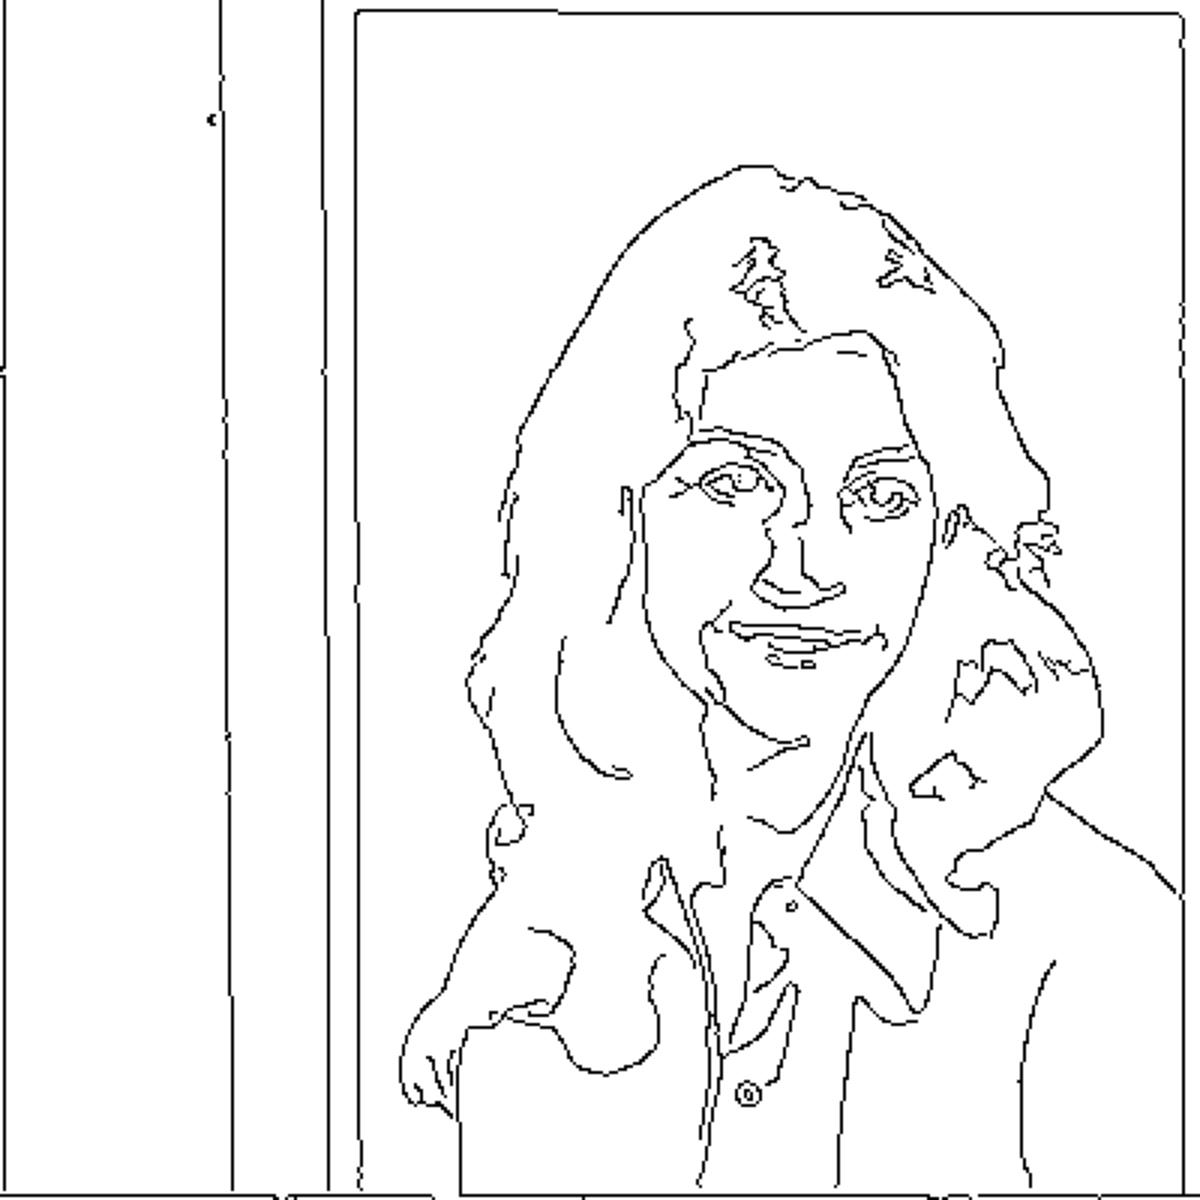
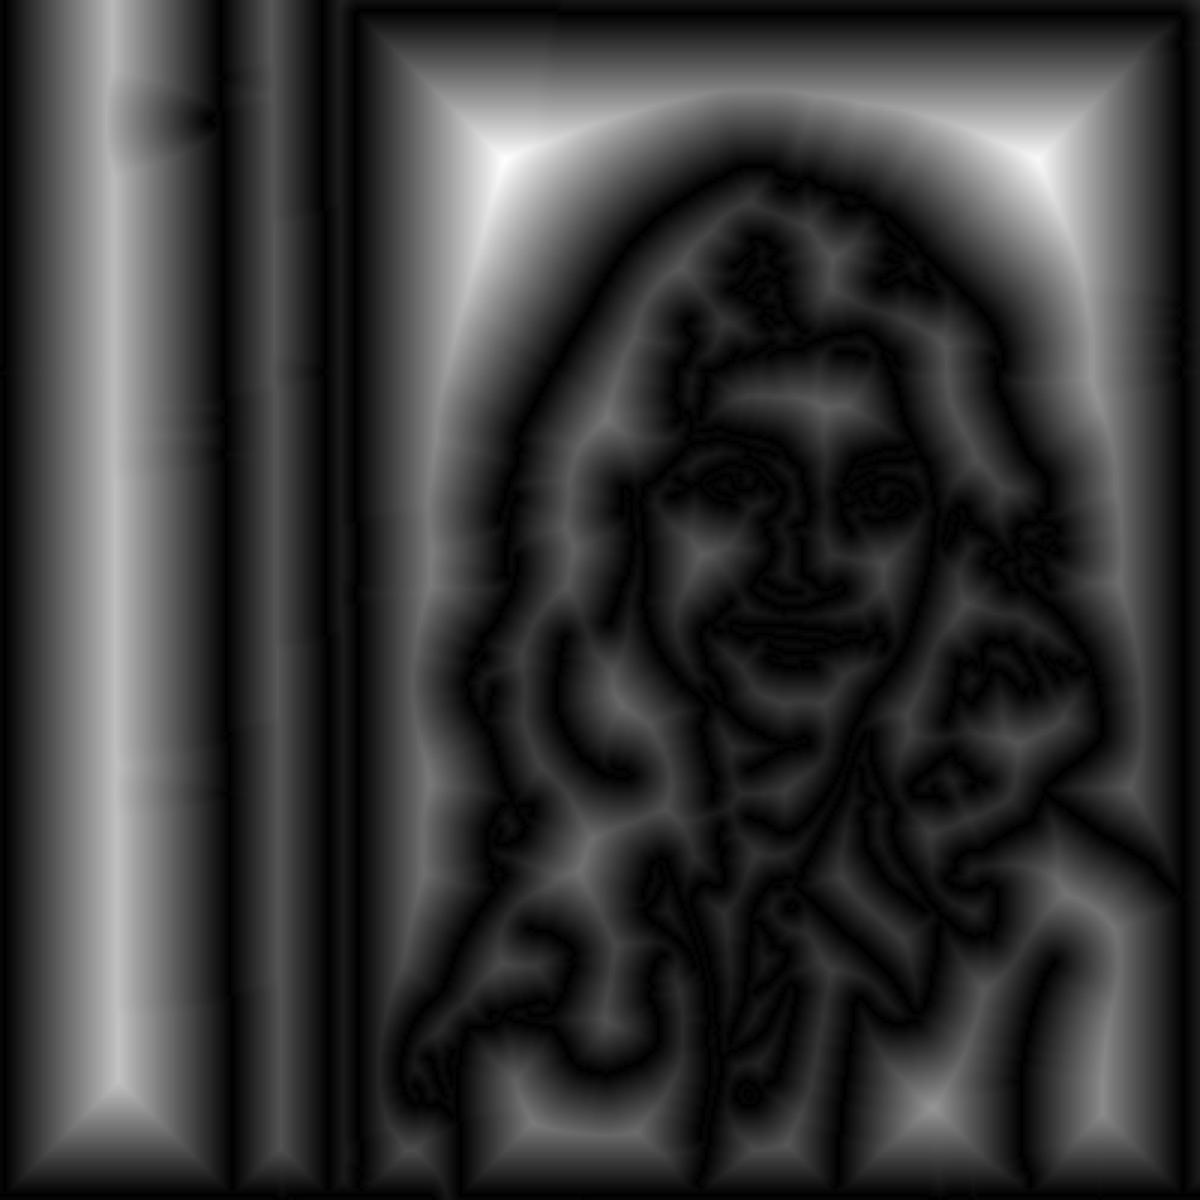
Now, the first key idea : the Euclidean Distance Transform will give the distance of a point to the closest edge. When you have this distance, then you can draw a circle which will not cross any edge. Since distances will be > 1.0, you need an ImageAdjust if you want to display the result. I do it only as an illustration since this step is part of the main function.
DistanceTransform[edges] // ImageAdjust
Generation of the circles
The function below will try to place all the circles starting from the biggest to the smallest. The different scales to be considered are given by the list d.
d = {50, 20, 10, 5, 3, 2};
So, for instance, during the first pass, we will consider only the points with with an euclidean distance > 50.0. This euclidean distance is the radius of the circle to place at this point.
We may not be able to place all the circles because of overlap with the circles already in place. So, when a circle cannot be placed, it is resized during the next phase. All circles with radius > 50.0 will be resized to radius 50.0. If they still can't get a place, then during the next phase they will be resized to 20 ...
The overlap detection is the part to be optimized : I am comparing the circle to all of the already placed circles. Some partitioning of the plane may be useful to make this comparison quicker and avoid testing circles which are too far. In this version, it is the biggest limiting factor is you want to process big pictures.
result = circlism[d, edges];
The circlism function is returning a list of {position,radius}.
We use this list to draw the final pictures.
Two options are used by this function. "TimeConstraint" is set by default to 3 minutes. The image generation will stop after 3 minutes so you may not have all the circles.
"Pad" is set to 0.0 and controlling the padding between the circles.
Picture Generation
Many variations are possible.
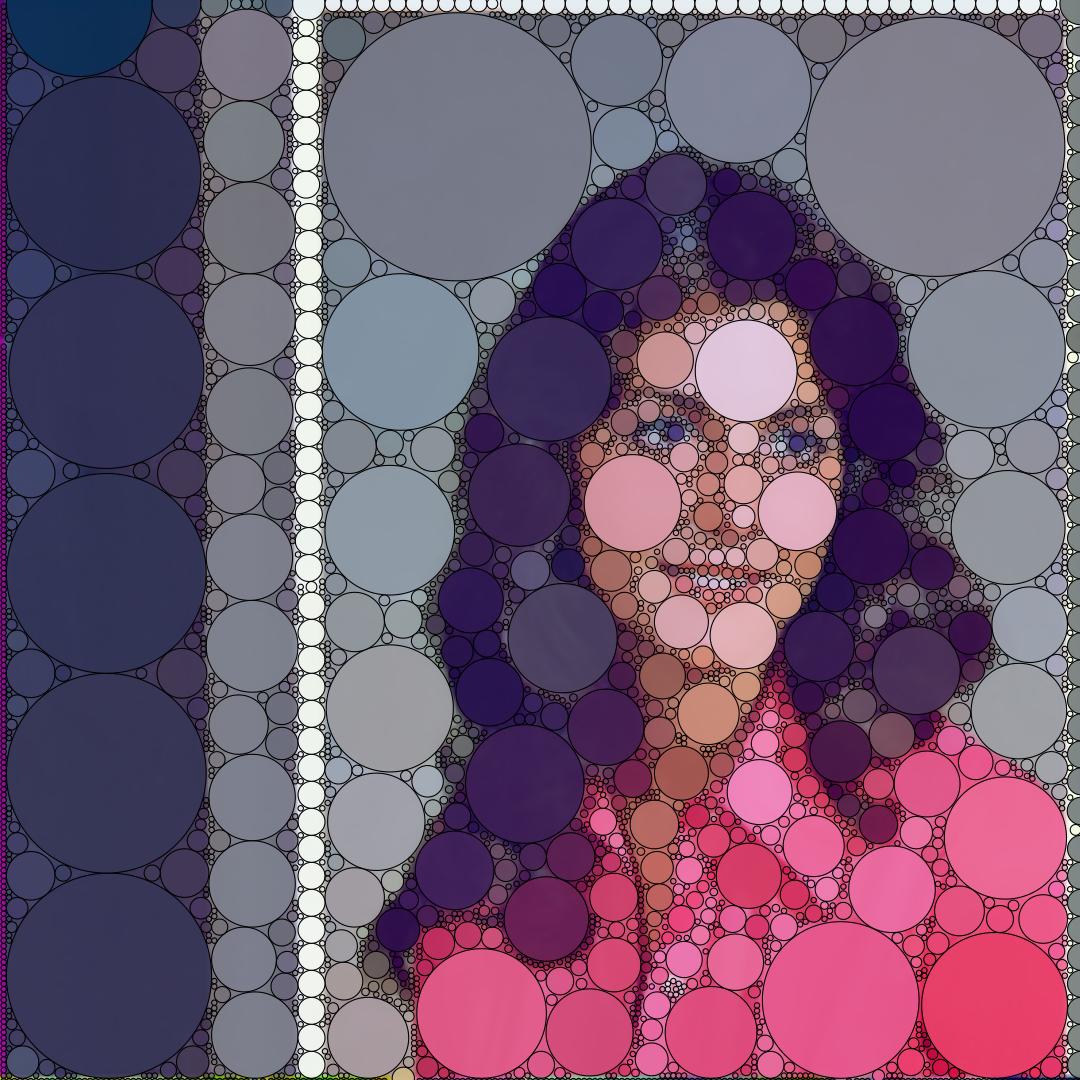
In this first picture, we just overlay the disks on top of the picture. The color of the disk is the color of the picture pixel at the center of the disk.
Show[srcImage,
 Graphics[{EdgeForm[Thickness[0.001]],
   MapThread[{imgColor[#1], Opacity[0.9], Disk[#1, #2]} &, result]}]]
In this variation, we use an uniform background. I am generating this background with an ImageApply because I have observed that the Show is clipping the Graphics as it should when an image is used.
Show[uniformBackground[0.8],
 Graphics[{EdgeForm[],
   MapThread[{imgColor[#1], Disk[#1, #2]} &, result]}]]
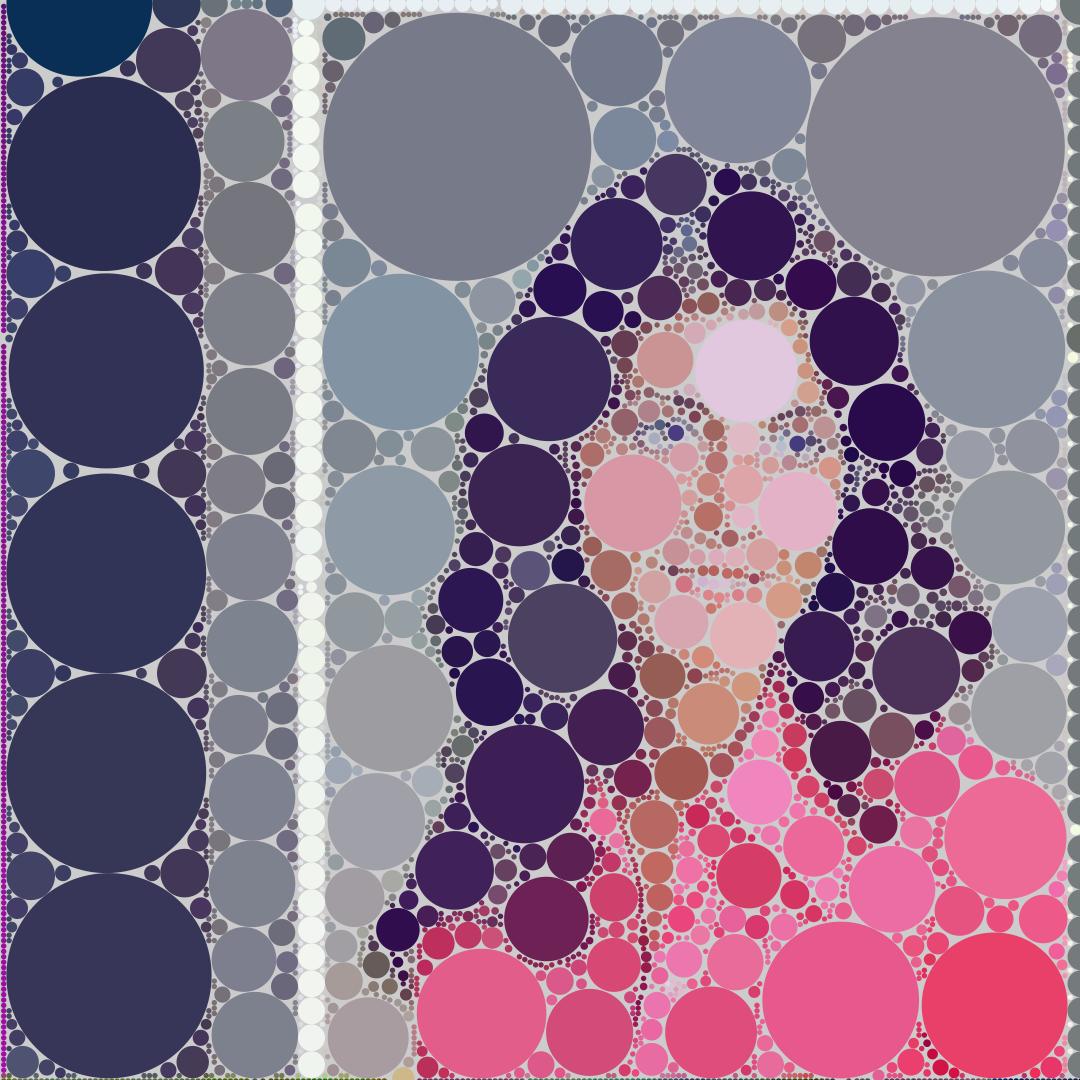
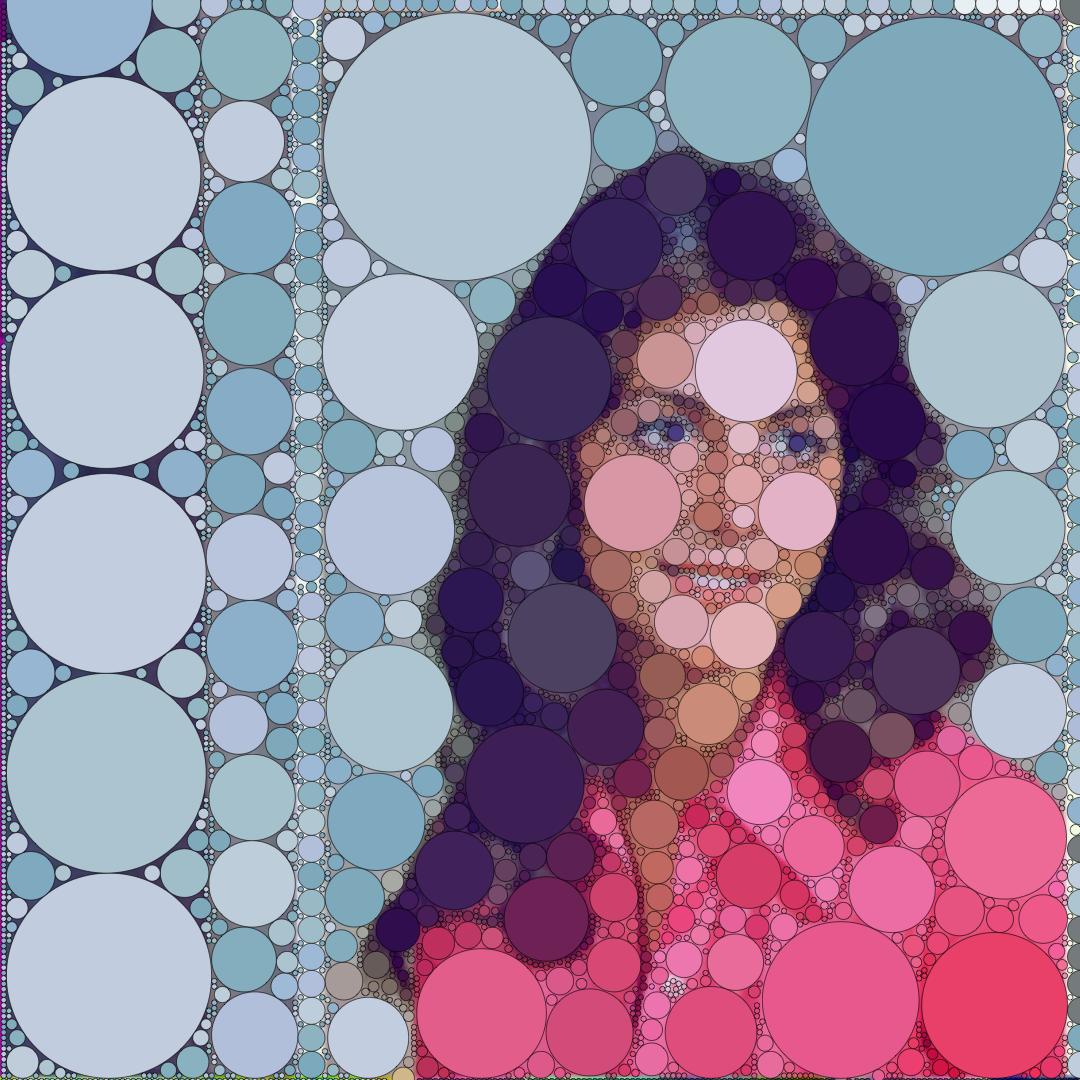
In this other variation, we use the colFunc function which is using a background mask. For circles in the background, a random color from a palette is used.
Show[srcImage,
 Graphics[{EdgeForm[Thin],
   MapThread[{colFunc["Aquamarine", #1], Disk[#1, #2]} &, result]}]]
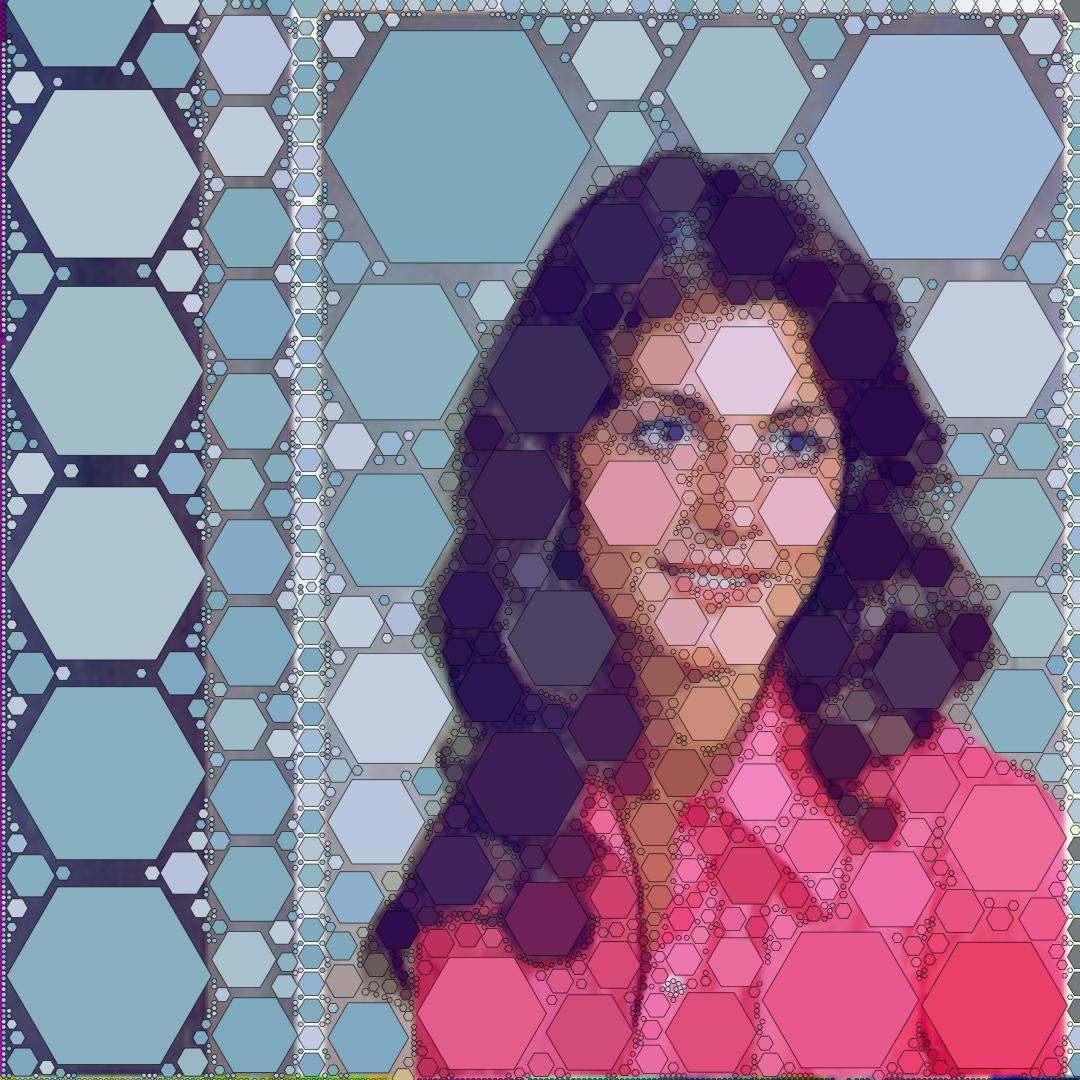
Why only use circles ?
Show[srcImage,
 Graphics[{EdgeForm[Thin],
   MapThread[{colFunc["Aquamarine", #1], RegularPolygon[#1, #2, 6]} &,
     result]}]]
 Attachments: