Message Boards Message Boards

6
|
8614 Views
|
18 Replies
|
22 Total Likes
View groups...
Share
Share this post:

Why is there a grid pattern in Opacity+Rasters in 12.3?

Not sure why this is happening. I have used the same code for years but in 12.3 I see strange things happening. Can anybody reproduce this.

im1 = Rescale@Table[i, {i, 50}, {j, 50}];
im2 = Rescale@Table[j, {i, 50}, {j, 50}];

r1 = Raster[im1, ColorFunction -> ColorData["GrayTones"]];
r2 = Raster[im2, ColorFunction -> ColorData["SunsetColors"]];
GraphicsRow[{Graphics[r1], Graphics[r2], 
  Graphics[{r1, {Opacity[.3], r2}}]}]

enter image description here

When I rescale images the pattern changes.

enter image description here

Its also rendered when converting to images

GraphicsRow[
 Image /@ {Graphics[r1], Graphics[r2], Graphics[{Opacity[.5], r2}], 
   Graphics[{r1, {Opacity[.3], r2}}]}]

enter image description here

enter image description here

And it also is there when exporting to jpeg or other image formats, but depends on the image resolution used.

Export["test-d.jpg", Graphics[{r1, {Opacity[.3], r2}}]];
Export["test-h.jpg", Graphics[{r1, {Opacity[.3], r2}}], 
  ImageResolution -> 1200];

default resolution

enter image description here

high resolution

enter image description here

That little piece of code is the backbone of my image viewer that I use on a daily basis so would love to have a solution. enter image description here enter image description here

And I noticed it's also there in the documentation of Raster (at least on my system).

enter image description here

It doesn't happen in Wolfram cloud

enter image description here

POSTED BY: Martijn Froeling
18 Replies

The team was indeed aware and have fixed it in 13.

enter image description here

POSTED BY: Martijn Froeling

OK final post here. Did some more code optimization.

Both functions generate the same image (with some color rounding errors since I only use a fixed amount of colors). But since the output is "identical", so is the frontend time to render the images. Therefore we only have to look at the kernel time to compare. I get a 7x improvement in kernel time which for my application is what I need.

enter image description here

enter image description here

And for people interested the final code.

(*some fixed settings*)
ncol = 512;
colfuncs = {"Normal", "Reverse", "Symmetric", "Reverse Symmetric"};
colorNames = {"GrayTones", "Rainbow", "ThermometerColors",
   "SunsetColors", "TemperatureMap", "LightTemperatureMap",
   "GrayYellowTones", "BlueGreenYellow", "AvocadoColors",
   "SouthwestColors"};
colorFunctions = # -> ColorData[#] & /@ colorNames;

(*convert a RBBColor to {r,g,b,alpha} with each 0-255 integers*)
Attributes[Col2List] = {Listable};
Col2List[RGBColor[c___]] := Round[255 PadRight[List[c], 4, 1.]]
(*needed to convert white, black an transparent*)
Col2List[c_] := Col2List[RGBColor[c]]

(*define the color function orders*)
ColSel[func_, cfunc_] := With[{fun = Switch[func,
     "Normal", #1 &,
     "Reverse", 1 - #1 &,
     "Symmetric", Abs[2 #1 - 1] &,
     "Reverse Symmetric", Abs[Abs[2 #1 - 1] - 1] &]
   , cfun = cfunc /. colorFunctions}, cfun[fun[#]] &]

(*generate all the color lookup tables*)
ColorLookup[___] = ConstantArray[Col2List[Darker[Red]], ncol];
With[{ran = Range[0, 1., 1./(ncol - 1)]}, 
  Table[ColorLookup[j, i] = Col2List[ColSel[j, i][#] & /@ ran], {j, 
    colfuncs}, {i, colorFunctions[[All, 1]]}]];

(*color lookup function, prosersing clipping and transparentcy. It \
converts color index to color values*)
LookUpTable[{lstyle_, color_}, {minclip_, maxclip_}] := With[{
   (*generate color lookup table with correct clipping colors for min \
and max,add opacity for Image function*)
   collist = 
    Join[{Col2List[minclip]}, (ColorLookup[lstyle, color]), {Col2List[
       maxclip]}]
   }, Function[{x}, 
   Which[NumberQ[x] || VectorQ[x], collist[[x]], MatrixQ[x], 
    collist[[#]] & /@ x]]
  ]

(*converts numbers to integers for color lookup, accounting for \
clipped values*)
ColorRound = With[{n = ncol}, Compile[{{x, _Real, 0}, {r, _Real, 1}},
    n + 2 - 
     Ramp[n + 1 - 
       Ramp[1 + Round[(n - 1) ((x - r[[1]])/(r[[2]] - r[[1]]))]]],
    RuntimeOptions -> "Speed", RuntimeAttributes -> {Listable}]];

(*the "fast" image function with the needed options*)
Options[FastImage] = {
   PlotRange -> Automatic,
   ClippingStyle -> {Black, White},
   ImageOpacity -> 1,
   ColorFunction -> "Rainbow",
   ColorFunctionOrder -> "Normal",
   ImageSize -> 300
   };

FastImage[data_, OptionsPattern[]] := 
 Block[{cfo, cf, cl1, cl2, tcl, plr, op, imAll, size},
  (*get the options*)
  cfo = OptionValue[ColorFunctionOrder];
  cf = OptionValue[ColorFunction];
  {cl1, cl2} = OptionValue[ClippingStyle];
  plr = OptionValue[PlotRange] /. Automatic -> MinMax[data];
  op = OptionValue[ImageOpacity];
  size = OptionValue[ImageSize];

  (*convert number to color index*)
  imAll = LookUpTable[{cfo, cf}, {cl1, cl2}][ColorRound[data, plr]];
  (*add correct opacity if needed*)
  If[op < 1, imAll[[All, All, 4]] = Round[op imAll[[All, All, 4]]],
   If[Col2List[cl1][[-1]] === 255 && Col2List[cl2][[-1]] === 255,
    imAll = imAll[[All, All, 1 ;; 3]]]];
  (*make image*)
  Image[NumericArray[imAll, "UnsignedInteger8"], "Byte", 
   ColorSpace -> "RGB", ImageSize -> size, Magnification -> Automatic]
  ]
POSTED BY: Martijn Froeling

... Until i realize that Image with Opacity also gives artifacts...

enter image description here

well at least I learned a few things, Version 13 will be the solution then...

EDIT

but only without another image as background... so I'm still good

enter image description here

POSTED BY: Martijn Froeling

Yes indeed that is my experience as well, but your input got me inspired. I use most of my visualization code within Manipulate. So from all the information here a short kernel time and a short frontend time will result in a "smoother experience".

Image has by far the best frontend time, so is it possible to reduce the kernel time?

I noticed when explicitly giving Image the RGB and alpha values and forcing ColorSpace->"RGB" makes Image much faster. So the challenge was how to efficiently convert an arbitrary range of data values to RGB values and feeding that to Image. Also, I needed some specific options for the code to work in the larger scope.

My solution now is to pre-generate some lookup tables with predefined gradients. Next, I convert my data to integers with the same range as the length of the color lookup table. Finally, it is just selecting the correct color values from the lookup table.

With that, i end up with something faster than both the Graphics option or the Colorize@Image option and with the flexibility that I needed.

enter image description here enter image description here enter image description here

and this allows me to use ImageCompose.

enter image description here

And most important it runs very smoothly within manipulate with the size of images I typically work with.

(*some fixed settings*)
ncol = 1024;
colfuncs = {1 -> "Normal", 2 -> "Reverse", 3 -> "Symmetric", 
   4 -> "Reverse Symmetric"};
colfuncsR = Reverse /@ colfuncs;
colorNames = {"GrayTones", "Rainbow", "ThermometerColors",
   "SunsetColors", "TemperatureMap", "LightTemperatureMap",
   "GrayYellowTones", "BlueGreenYellow", "AvocadoColors",
   "SouthwestColors"};

(*convert a RBBColor to {r,g,b,alpha}*)
ClearAll[Col2Num];
Col2Num[c_] := N@Join[List @@ c, {1}];

(*define the color function orders*)
ClearAll[ColSel]
ColSel[func_, cfunc_] := 
 With[{fun = {# &, 1 - # &, Abs[(2 # - 1)] &, 
      Abs[Abs[(2*#) - 1] - 1] &}[[func]]}, ColorData[cfunc][fun[#]] &]

(*generate all the color lookup tables*)
ClearAll[ColorLookup2]
ColorLookup2[___] = Darker[Red];
With[{ran = Range[0, 1., 1./(ncol - 1)]}, Table[
   ColorLookup2[j, i] = Col2Num[ColSel[j, i][#]] & /@ ran,
   {j, 1, 4}, {i, colorNames}]];

(*color lookup function, presersing clipping and transparentcy. It \
converts integers to color values*)
(*returs the color function*)
ClearAll[LookUpTable3]
LookUpTable3[{lstyle_, color_}, {trans_, minclip_, maxclip_}, {pmin_, 
   pmax_}] := Module[{collist, fun, minc, maxc},
  (*generate color lookup table with correct clipping colors for min \
and max,add opacity for Image function*)
  collist = If[trans,
    {{1., 1., 1., 0.}}~Join~(ColorLookup2[lstyle, color])~
     Join~{{1., 1., 1., 0.}},
    {Col2Num[minclip]}~Join~(ColorLookup2[lstyle, color])~
     Join~{Col2Num[maxclip]}
    ];
  (*define the color function fun*)
  fun[x_?VectorQ] := collist[[x]];
  fun[x_?MatrixQ] := collist[[#]] & /@ x;
  fun
  ]

(*converts numbers to integers for color lookup*)
ClearAll[ColorRound2]
ColorRound2 = With[{n = ncol},
   Compile[{{x, _Real, 0}, {pmin, _Real, 0}, {pmax, _Real, 0}},
    If[pmin <= x <= pmax, 
     Round[(n - 1) ((x - pmin)/(pmax - pmin))] + 2, 
     If[x < pmin, 1, n + 2]],
    RuntimeOptions -> "Speed", RuntimeAttributes -> {Listable}]
   ];

(*the "fast" image function with the needed options*)
Options[FastImage] = {
   PlotRange -> Automatic,
   TransparentClipping -> False,
   ClippingStyle -> {Black, White},
   ImageOpacity -> 1,
   ColorFunction -> "Rainbow",
   ColorFunctionOrder -> "Normal"
   };

FastImage[data_, OptionsPattern[]] := 
 Block[{cfo, cf, cl1, cl2, tcl, plr, op, imAll},
  cfo = OptionValue[ColorFunctionOrder] /. colfuncsR;
  cf = OptionValue[ColorFunction];
  {cl1, cl2} = OptionValue[ClippingStyle];
  tcl = OptionValue[TransparentClipping];
  plr = OptionValue[PlotRange] /. Automatic -> MinMax[data];
  op = OptionValue[ImageOpacity];

  imAll = 
   LookUpTable3[{cfo, cf}, {tcl, cl1, cl2}, plr][
    ColorRound2[data, plr[[1]], plr[[2]]]];
  SetAlphaChannel[
   Image[imAll[[All, All, ;; -2]], ColorSpace -> "RGB", 
    ImageSize -> 300], Image[op imAll[[All, All, {-1}]]]]
  ]

(*make the data and manipulate*)

im = 750;
data = ToPackedArray@N@Table[i, {i, 1, im}, {j, 1, im}];

{mi, ma} = MinMax[data];
ra = ma - mi;

Manipulate[
 FastImage[data,
  PlotRange -> {min, max},
  TransparentClipping -> trans,
  ClippingStyle -> {minCl, maxCl},
  ImageOpacity -> op,
  ColorFunction -> col,
  ColorFunctionOrder -> cfun]
 ,
 {{min, mi}, mi, Dynamic[max - 0.01 ra], ra/100},
 {{max, ma}, Dynamic[min + 0.01 ra], ma, ra/100},
 {col, colorNames},
 {{trans, False}, {True, False}},
 {{op, 1}, 0, 1},
 {minCl, Red},
 {maxCl, Blue},
 {cfun, colfuncs}]

enter image description here

POSTED BY: Martijn Froeling
Posted 2 years ago

As you can see, this method suddenly demonstrates the picture opposite to yours.

This result can be partially attributed to a significant difference in byte size between graphics and imagel:

ByteCount /@ {graphics, imagel}
 {8000488, 3000608}

This is due to the fact that graphics stores a packed array of "Real64" values, while imagel stores a NumericArray of type "Byte". A fair comparison is to use identical encoding in both cases:

SetOptions[$FrontEnd, EvaluationCompletionAction -> "ShowTiming"]
$HistoryLength = 0;

im=4000;
data=RandomInteger[{0,255},{im,im}];
rasterData=NumericArray[data];
imageData=Reverse@data;

Graphics[Raster[rasterData, Automatic, {0, 255},
   ColorFunction -> "SunsetColors"], ImageSize -> 100]

Colorize[imageData, ColorFunction -> "SunsetColors", ImageSize -> 100]

Here are my timings:

screenshot1

screenshot2

We see that in Mathematica 12.3.1 Raster is actually much faster than Colorize. Of course, it is possible to improve the speed by replacing Colorize with a compiled function.

POSTED BY: Alexey Popkov
Posted 2 years ago

Another possible approach for measuring evaluation&rendering time is by using the CellChangeTimes option of the printed cells.

My experiments with screen recording software show that the last value of the CellChangeTimes option of a printed cell reflects the time when this cell was fully prepared for rendering, not the time when its rendering was finished. Hence with this approach, one should output a dummy cell after the cell of interest, and take the last value of the CellChangeTimes option of this dummy cell as the time of finishing rendering of the previous cell. The complete evaluation&rendering time computed in this way agrees closely with what the screen recording software records and also with the content of WindowStatusArea after finishing the evaluation (when EvaluationCompletionAction->"ShowTiming" is set).

POSTED BY: Alexey Popkov

Awsome, always look forward to new versions!

POSTED BY: Martijn Froeling
Posted 2 years ago

I think tentatively you may also look forward to version 13.0. Our teams are aware of this discussion. Thank you all for your thoughts.

POSTED BY: Vitaliy Kaurov

That's very interesting! Will definitely look further into this. It's a completely new approach to me evaluation computation and render times like this.

Thanks for the excellent ideas.

POSTED BY: Martijn Froeling
Posted 2 years ago

Note that with your approach you can't be sure that TimeObject[Now, "Instant"] will be evaluated after finishing of rendering of the graphics by the FrontEnd. I suggest you trying to measure the complete evaluation&rendering time using the option

SetOptions[$FrontEnd, EvaluationCompletionAction -> "ShowTiming"]

With this option, I get completely different results as compared to your approach. Here are my results:

screenshot1

screenshot2

As you can see, this method suddenly demonstrates the picture opposite to yours.

Another possible approach for measuring evaluation&rendering time is by using the CellChangeTimes option of the printed cells.

Here is the code I used (split in two cells):

im=1000;
data=RandomReal[{-.1,1.1},{im,im}];
tl=TimeObject[Now,"Instant"];
graphics = Graphics[Raster[data, ColorFunction->"SunsetColors"],ImageSize->100]; 
t2=TimeObject[Now,"Instant"];
graphics
t3=TimeObject[Now,"Instant"];
N@<|"KernelTime"->Round[t2 - tl,$TimeUnit],"FrontEndTime"->Round[t3-t2,$TimeUnit]|>

tl= TimeObject[Now, "Instant"];
imagel = Colorize[Image[data], ColorFunction -> "SunsetColors", ImageSize ->100];
t2 = TimeObject[Now, "Instant"];
imagel
t3=TimeObject[Now,"Instant"];
N@<|"KernelTime"->Round[t2 - tl,$TimeUnit],"FrontEndTime"->Round[t3-t2,$TimeUnit]|>
POSTED BY: Alexey Popkov

Indeed, but including the render time of the front end, it still makes a difference (40 or 4 frames per second).

enter image description here

POSTED BY: Martijn Froeling
Posted 2 years ago

Your timings reflect only the CPU time spent by the Kernel but not the FrontEnd rendering time. The reason why for your approach the timings are so small is that your code does almost nothing in the Kernel.

POSTED BY: Alexey Popkov

Hi Alexey,

Thanks for the input! Yes, I noticed that rasterizing graphics removes the problem. (Image is basically Rasterize[Graphics[]] as far as I get it at least).

However, I would really like to keep using the Head Graphics, since I use many of the options later that Graphics has but Image does not.

Furthermore, all the plot functions including Image are slow compared to Raster and their performance does not really scale well with the image size. I'm using this code in a Manipulate for dynamic interaction where one really notices the difference in speed.

TableForm[
 Table[
  data = RandomReal[{-.1, 1.1}, {im, im}];

  graphics = 
   Graphics[Raster[data, ColorFunction -> "SunsetColors"]] // 
     RepeatedTiming // First;
  array = 
   ArrayPlot[data, ColorFunction -> "SunsetColors", 
      ColorFunctionScaling -> False, Frame -> False] // 
     RepeatedTiming // First;
  image1 = 
   Colorize[Image[data], ColorFunction -> "SunsetColors"] // 
     RepeatedTiming // First;
  image2 = 
   Image[Reverse@Map[ColorData["SunsetColors"][#] &, data, {2}]] // 
     RepeatedTiming // First;

  Round[{im, 1000 graphics, array, image1, image2}, .0001]
  , {im, 50, 500, 50}],
 TableHeadings -> {None, {"Image\nDimensions", "Graphics\n[ms]", 
    "Array\n[s]", "Image\nColorize [s]", "Image\nMap [s]"}}]

enter image description here

Diving into the issue further, it seems there is more wrong with the meshing of Rasters in ArrayPlot.

enter image description here enter image description here enter image description here

POSTED BY: Martijn Froeling
Posted 2 years ago

Hi Martijn,

That's a really strange bug. I can suggest switching to Image. The result seems to be perfect:

i1 = Image[Reverse@Map[List @@@ ColorData["GrayTones"][#] &, im, {2}], ImageSize -> Full];
i2 = Image[Reverse@Map[List @@@ ColorData["SunsetColors"][#] &, mask, {2}], ImageSize -> Full];
GraphicsRow[{i1, i2, ImageCompose[i1, {i2, .3}]}, ImageSize -> 1000]

output

POSTED BY: Alexey Popkov

Hi Ian,

After using this workaround for a while I'm now running into issues working with low res data.

im = {
   {0, 0, 0, 0, 0, 0, 0, 0, 0, 0, 0.1, 0, 0, 0.1, 0, 0},
   {0, 0, 0, 0, 0.1, 0.1, 0.1, 0, 0, 0, 0, 0, 0, 0, 0, 0},
   {0, 0, 0, 0, 0.1, 0.1, 0.1, 0, 0.1, 0.1, 0, 0, 0, 0, 0, 0},
   {0, 0, 0, 0.4, 0.8, 1, 0.7, 0.4, 0.6, 0.6, 0.4, 0.4, 0.3, 0, 0, 0},
   {0, 0.1, 0.5, 0.7, 0.9, 1, 0.7, 0.5, 0.6, 0.5, 0.4, 0.6, 0.6, 0.3, 
    0, 0},
   {0, 0.3, 0.6, 0.5, 0.4, 0.4, 0.5, 0.4, 0.4, 0.3, 0.2, 0.4, 0.5, 
    0.4, 0.1, 0},
   {0, 0.2, 0.2, 0.2, 0.2, 0.4, 0.5, 0.3, 0.3, 0.4, 0.3, 0.3, 0.5, 
    0.6, 0.2, 0},
   {0, 0.2, 0.5, 0.7, 0.6, 0.6, 0.5, 0.3, 0.3, 0.5, 0.5, 0.4, 0.5, 
    0.7, 0.2, 0.1},
   {0, 0, 0.4, 0.8, 0.8, 0.9, 0.9, 0.5, 0.4, 0.8, 0.9, 0.6, 0.3, 0.2, 
    0, 0},
   {0, 0, 0, 0.2, 0.4, 0.5, 0.5, 0.3, 0.3, 0.7, 0.7, 0.4, 0.1, 0, 0, 
    0},
   {0, 0, 0, 0, 0.1, 0.1, 0.1, 0, 0, 0.1, 0.1, 0, 0, 0, 0, 0},
   {0, 0, 0.1, 0.1, 0, 0, 0, 0, 0, 0.1, 0, 0, 0, 0, 0, 0}};

mask = {
   {0., 0., 0., 0., 0., 0., 0., 0., 0., 0., 0., 0., 0., 0., 0., 0},
   {0., 0., 0., 0., 0., 0., 0., 0., 0., 0., 0., 0., 0., 0., 0., 0},
   {0., 0., 0., 0., 0., 0., 0., 0., 0., 0., 0., 0., 0., 0., 0., 0},
   {0., 0., 0., 0.7, 0.7, 0.7, 0.7, 0.7, 0.7, 0.7, 0.7, 0.7, 0.7, 0., 
    0., 0},
   {0., 0., 0.7, 0.7, 0.7, 0.7, 0.7, 0.7, 0.7, 0.7, 0.7, 0.7, 0.7, 
    0.7, 0., 0},
   {0., 0.7, 0.7, 0.7, 0.7, 0.7, 0.7, 0.7, 0.7, 0.7, 0.7, 0.7, 0.7, 
    0.7, 0., 0},
   {0., 0.7, 0.7, 0.7, 0.7, 0.7, 0.7, 0.7, 0.7, 0.7, 0.7, 0.7, 0.7, 
    0.7, 0.7, 0},
   {0., 0., 0.7, 0.7, 0.7, 0.7, 0.7, 0.7, 0.7, 0.7, 0.7, 0.7, 0.7, 
    0.7, 0.7, 0},
   {0., 0., 0.7, 0.7, 0.7, 0.7, 0.7, 0.7, 0.7, 0.7, 0.7, 0.7, 0.7, 
    0.7, 0., 0},
   {0., 0., 0., 0., 0.7, 0.7, 0.7, 0.7, 0.7, 0.7, 0.7, 0.7, 0., 0., 
    0., 0},
   {0., 0., 0., 0., 0., 0., 0., 0., 0., 0., 0., 0., 0., 0., 0., 0},
   {0., 0., 0., 0., 0., 0., 0., 0., 0., 0., 0., 0., 0., 0., 0., 0}};

r1 = Raster[im, ColorFunction -> ColorData["GrayTones"]];
r2 = Raster[mask, ColorFunction -> ColorData["SunsetColors"]];

r1r = Raster[im, ColorFunction -> ColorData["GrayTones"], 
   ImageResolution -> 73];
r2r = Raster[mask, ColorFunction -> ColorData["SunsetColors"], 
   ImageResolution -> 73];

GraphicsRow[
 Style[#, Antialiasing -> True] & /@ {Graphics[r1], Graphics[r2], 
   Graphics[{r1, {Opacity[.3], r2}}]}, ImageSize -> 1000]
GraphicsRow[
 Style[#, Antialiasing -> False] & /@ {Graphics[r1], Graphics[r2], 
   Graphics[{r1, {Opacity[.3], r2}}]}, ImageSize -> 1000]
GraphicsRow[{Graphics[r1r], Graphics[r2r], 
  Graphics[{r1r, {Opacity[.3], r2r}}]}, ImageSize -> 1000]

enter image description here

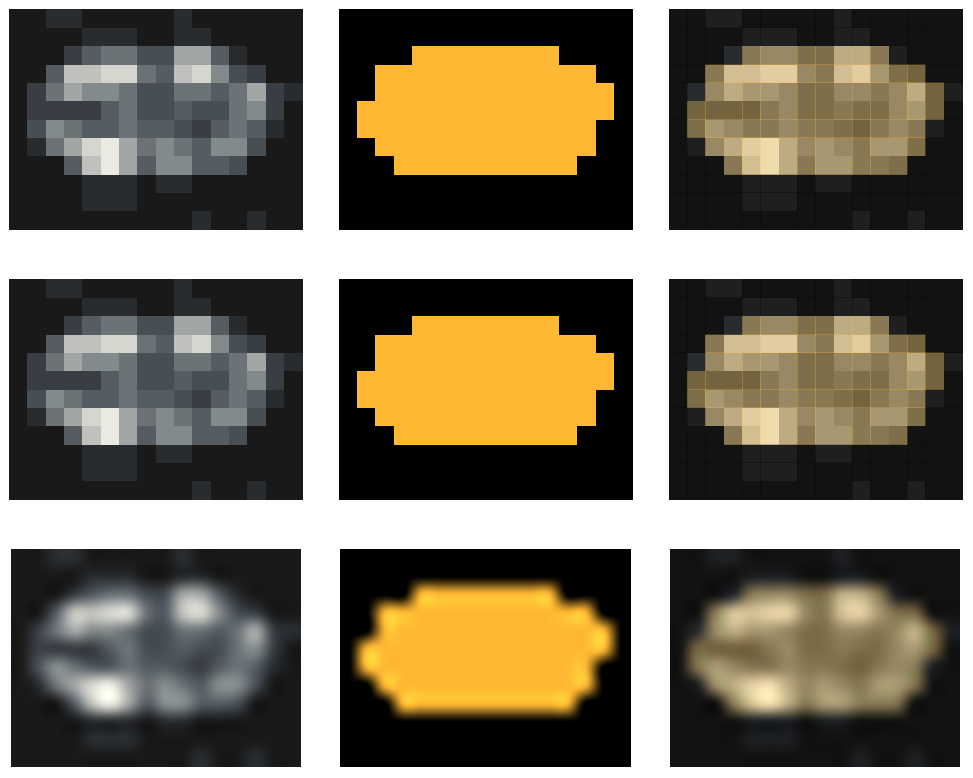
The ImageResolution does indeed still solves the issue but the images do not look like how I want them. Any other solutions you might have?

POSTED BY: Martijn Froeling

Thanks!

That solved the issue. Would have not figured that out on my own, since, ImageResolution is not a documented option of Raster. But I have nice smooth images again so very happy with the fix!

enter image description here

POSTED BY: Martijn Froeling

They are antialiasing artifacts from drawing the raster as a set of primitives. The simplest way to deal with this is to add ImageResolution->96 to each Raster.

POSTED BY: Ian Hojnicki
Reply to this discussion
Community posts can be styled and formatted using the Markdown syntax.
Reply Preview
Attachments
Remove
or Discard

Group Abstract Group Abstract