Here is a related Raku package: "Data::Cryptocurrencies".
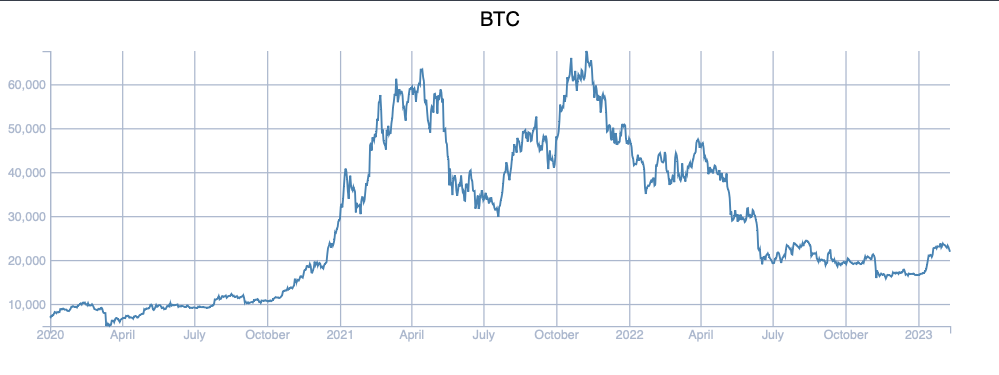
Compare the (Raku specified) D3.js plot:
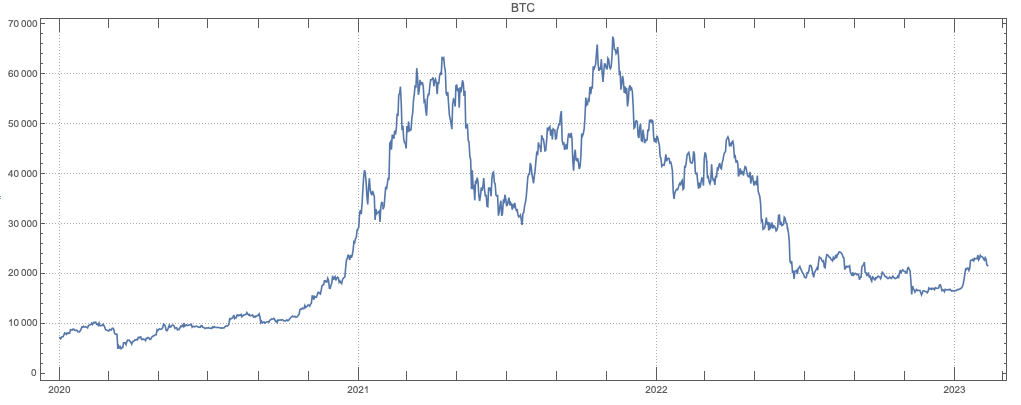
with the corresponding WL version:
ts = ResourceFunction[
CloudObject[
  "https://www.wolframcloud.com/obj/antononcube/DeployedResources/Function/CryptocurrencyData"]]["BTC", Automatic, {{2020, 1, 1}, Today}];

DateListPlot[ts, PlotRange -> All, PlotLabel -> "BTC",
 PlotTheme -> "Detailed", ImageSize -> 1000, AspectRatio -> 3/8]
Remark: At some point, I hope, I will make a comparison study between WL and D3.js over data science related plotting tasks.


