Thank you so much, Jim.
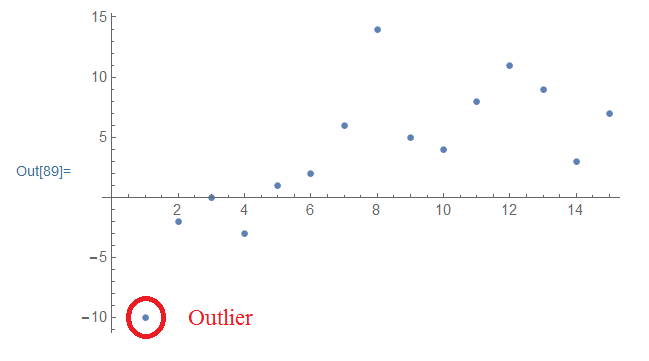
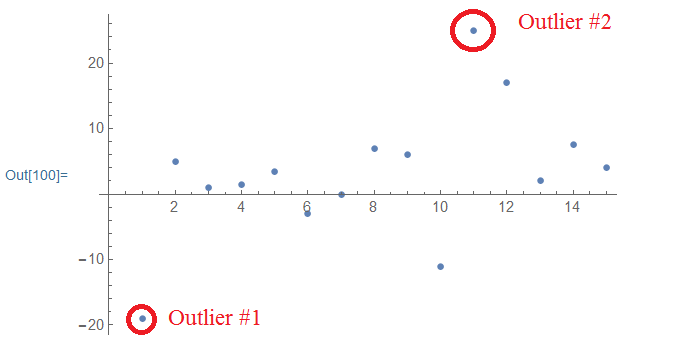
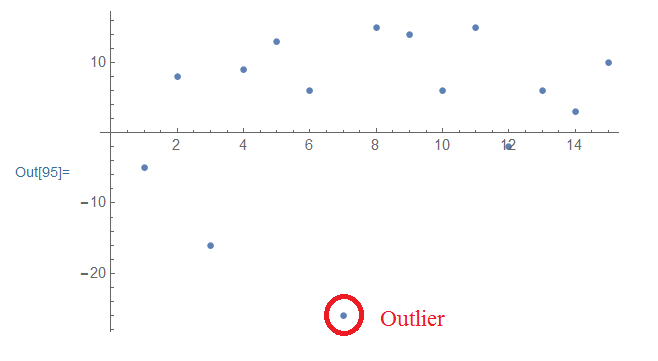
If we study a three-dimensional list data, (u,v,w) separately, then we get the below results:
u = {-10, -2, 0, -3, 1, 2, 6, 14, 5, 4, 8, 11, 9, 3, 7};

{min, max} = {Mean[u] - 2*StandardDeviation[u],
    Mean[u] + 2*StandardDeviation[u]} // N;

Select[u, Or[# > max, # < min] &];

ListPlot[u]

v = {-19, 5, 1, 1.5, 3.5, -3, 0, 7, 6, -11, 25, 17, 2, 7.5, 4};

{min, max} = {Mean[v] - 2*StandardDeviation[v],
    Mean[v] + 2*StandardDeviation[v]} // N;

Select[v, Or[# > max, # < min] &];

ListPlot[v]

w = {-5, 8, -16, 9, 13, 6, -26, 15, 14, 6, 15, -2, 6, 3, 10};

{min, max} = {Mean[w] - 2*StandardDeviation[w],
    Mean[w] + 2*StandardDeviation[w]} // N;

Select[w, Or[# > max, # < min] &];

Now for all of the lists in a 3D list we have :

How do I remove these three elements sublists from the data?
I appreciate your kindness and help.