Message Boards Message Boards

1
|
7254 Views
|
15 Replies
|
14 Total Likes
View groups...
Share
Share this post:

Remove outliers from a 3D list

Posted 2 years ago

Hi,

For removing outliers for a 1D list of data e.g. {5,3,8,10,8,2}, I did the following procedure:

{min, max} = {Mean[data] - 2*StandardDeviation[data], 
  Mean[data] + 2*StandardDeviation[data]}

The outliers are : Select[data, Or[# > max, # < min] &]

Now if we have a 3D list of data e.g., {{-1.197, -1.169, 0.424}, {-3.597, 1.220, 2.234},..........}

How is it possible to fit a 3D ellipse to this data?

Can we remove the outlier with the help of the fitted ellipse? I enclosed the real data.

I appreciate your help.

Attachments:
POSTED BY: Alex Teymouri
15 Replies
Posted 2 years ago

Check out this post.

POSTED BY: Mike Besso
Posted 2 years ago

It would be best to define what an "inlier" is first or at least call the odd values "potential outliers". The point is that if one is doing real science, then all "outliers" need to be explained as opposed to just finding them and tossing them out.

POSTED BY: Jim Baldwin
Posted 2 years ago

Thank you so much, Jim.

If we study a three-dimensional list data, (u,v,w) separately, then we get the below results:

u = {-10, -2, 0, -3, 1, 2, 6, 14, 5, 4, 8, 11, 9, 3, 7};

{min, max} = {Mean[u] - 2*StandardDeviation[u], 
    Mean[u] + 2*StandardDeviation[u]} // N;

Select[u, Or[# > max, # < min] &];

ListPlot[u]

enter image description here

v = {-19, 5, 1, 1.5, 3.5, -3, 0, 7, 6, -11, 25, 17, 2, 7.5, 4};

{min, max} = {Mean[v] - 2*StandardDeviation[v], 
    Mean[v] + 2*StandardDeviation[v]} // N;

Select[v, Or[# > max, # < min] &];

ListPlot[v]

enter image description here

w = {-5, 8, -16, 9, 13, 6, -26, 15, 14, 6, 15, -2, 6, 3, 10};

{min, max} = {Mean[w] - 2*StandardDeviation[w], 
    Mean[w] + 2*StandardDeviation[w]} // N;

Select[w, Or[# > max, # < min] &];

enter image description here

Now for all of the lists in a 3D list we have :

enter image description here

How do I remove these three elements sublists from the data?

I appreciate your kindness and help.

POSTED BY: Alex Teymouri
Posted 2 years ago

Hi Alex,

Here is one way

{min, max} = {Mean[data] - 2*StandardDeviation[data], Mean[data] + 2*StandardDeviation[data]};
limits = Transpose[{min, max}];

data // Select[
 Between[#[[1]], limits[[1]]] && Between[#[[2]], limits[[2]]] && Between[#[[2]], limits[[2]]] &]
POSTED BY: Rohit Namjoshi
Posted 2 years ago

Dear Rohit, you always are great. Thank you so much.

I got a small error in the output.

enter image description here

POSTED BY: Alex Teymouri

Hello Alex,

basically and in principle I do share Jim's point of view. But just to get things done, here is a "quick and dirty" approach (you are asking for outliers in 3D):

u = {-10, -2, 0, -3, 1, 2, 6, 14, 5, 4, 8, 11, 9, 3, 7};
v = {-19, 5, 1, 1.5, 3.5, -3, 0, 7, 6, -11, 25, 17, 2, 7.5, 4};
w = {-5, 8, -16, 9, 13, 6, -26, 15, 14, 6, 15, -2, 6, 3, 10};
pts = Transpose[{u, v, w}];
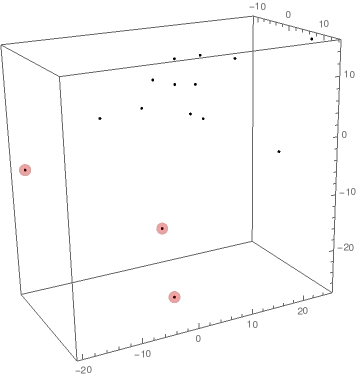
anomPts = FindAnomalies[pts, PerformanceGoal -> "Quality", Method -> "Multinormal"];
Graphics3D[{Point[pts], Red, Opacity[.2], Sphere[anomPts, 1]}, Boxed -> True, Axes -> True]

enter image description here

POSTED BY: Henrik Schachner
Posted 2 years ago

Not sure what you mean. In the image you annotated with outliers, {2, -3, 6} is not an outlier, so it is present in the result.

POSTED BY: Rohit Namjoshi
Posted 2 years ago

I am sorry, Rohit.

I mean was (6,0,-26) .

POSTED BY: Alex Teymouri
Posted 2 years ago

I do believe in outliers. But I also believe that when doing science (or even making a decision for a business) one must not just look for and toss "inconvenient" observations.

Context matters. Are the dimensions in the same units? Are the dimensions of equal importance? How is the data collected? Are the "potential outliers" just in a region of space not explored as intensively as other regions?

There is no algorithm void of subject matter knowledge that will appropriately find outliers. Such algorithms ignorant of how the data was collected might help "round up the usual suspects" but each suspected outlier needs to be vetted (with vetting also for some observations that "seem OK").

And if one has less than 50 observations, one probably has no business looking for an automated outlier detection algorithm.

POSTED BY: Jim Baldwin
Posted 2 years ago

Ah. My careless copy/paste error. Should be

data // Select[
  Between[#[[1]], limits[[1]]] && Between[#[[2]], limits[[2]]] && Between[#[[3]], limits[[3]]] &]
POSTED BY: Rohit Namjoshi
Posted 2 years ago

Hi Henrik,

Thank you so much for the interesting method.

I get different results every time I run the program. enter image description here

POSTED BY: Alex Teymouri
Posted 2 years ago

I appreciate your help, Rohit.

POSTED BY: Alex Teymouri
Posted 2 years ago

Hi Jim,

Thank you so much for your useful explains. I have more than 5000 data for finding outliers. I just wanted to learn with the lists including small numbers of elements.

POSTED BY: Alex Teymouri

Dear Henrik,

Alex is right. I got different results every time.

Using the " Seed" command can help in this case?

POSTED BY: M.A. Ghorbani
Posted 2 years ago

Hi Mohammad,

Take a look at Andreas Lauschke's livecoding session on anomaly detection on YouTube.

POSTED BY: Rohit Namjoshi
Reply to this discussion
Community posts can be styled and formatted using the Markdown syntax.
Reply Preview
Attachments
Remove
or Discard

Group Abstract Group Abstract