Hi Antonia,
Since you're at Heidelberg I'm sure you already know this, but for a genus one surface, you only need two charts, for example:
rotInds = Transpose[{Range[8], Flatten[
     Position[Tuples[{1, -1}, 3],
        RotationMatrix[Pi/2, {0, 0, 1}].#
        ] & /@ Tuples[{1, -1}, 3]]}];

Graphics3D[{Thickness[.025], Arrowheads[0.1],
   Red, GraphicsComplex[Tuples[{1, -1}, 3]/2,
    Arrow[Reverse[#]] & /@ Partition[Range[8], 2]],
   Blue, GraphicsComplex[Tuples[{1, -1}, 3]/2,
    Arrow[Reverse[#]] & /@ rotInds],
   Black, Sphere[#, 1/10] & /@ {{0, 0, 1/2}, {0, 0, -1/2}},
   Opacity[1/5], Cuboid[-{1/2, 1/2, 1/2}]
   }, Boxed -> False, ViewVertical -> {0, 0, 1}]
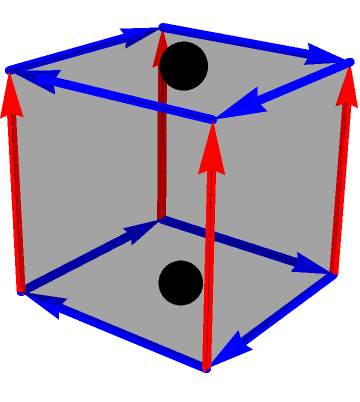
This graph is obtained by taking four squares from a planar lattice and wrapping them around four sides of a cube. Those four faces have locally Cartesian charts, while the other two have polar charts. The black spheres are special contraction points of the cyclic blue coordinate, and if one of them is chosen to be the origin, the other must be a point at infinity. Difficulty with infinities ultimately necessitates the two charts, which must differ by a sign on choice of origin.
I'm not exactly sure what's going on with your choice of coordinates, but it seems like you are trying to force Cartesian charts on every facet. That's fine, but if so, why even bother with a cyclic coordinate?
It's possible to have Cartesian charts on every facet and preserve Octahedral symmetry:
Graphics3D[Transpose[{{Red, Green, Blue},
   Function[{dir},
     {Arrow[{#, # + dir}], Arrow[{#, # - dir}]} & /@ Join[
       Complement[IdentityMatrix[3], {dir}],
       -Complement[IdentityMatrix[3], {dir}]]
     ] /@ IdentityMatrix[3]}]]
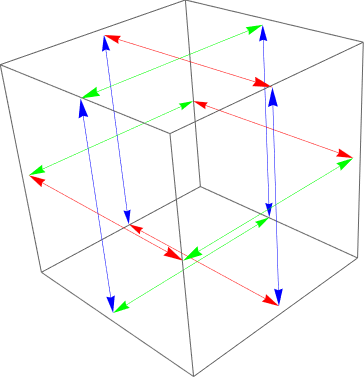
We can then take four quadrants on each facet as
$24$ separate charts, with positive direction always pointed out by the arrows. The transition maps are then trivial, at the cost of having
$6+8$ special points where three or more charts meet.
I'm really not trying to rain on your parade. When you are a physicist, you can always define charts however, even using an excessive number of colors, if that's what you want. Of course it is possible to go to higher symmetry, but you should also consider the voxel torus:
Graphics3D[{Cuboid[Append[#, 0]] & /@ Tuples[{-1, 1}, 2],
  Cuboid[Append[#, 0]] & /@ Join[IdentityMatrix[2],
    -IdentityMatrix[2]]}, Boxed -> False]
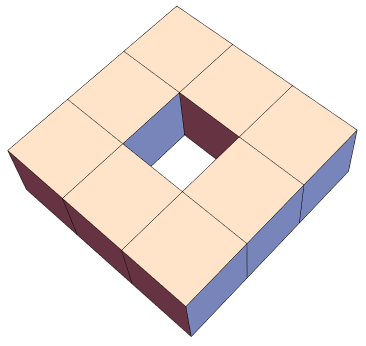
What is your preferred chart for the surface of this thing?
Relative to the recent (underappreciated?) thread on Dancing Pawns we could then ask to count origin-returning paths of some certain length. If so, we must be careful to specify an initial condition, because the voxel torus does not have the same translation symmetry as a checkerboard or a lattice.


