Group Abstract Group Abstract

Message Boards Message Boards

How can I do the output waveform of Schmitt trigger circuit?

Hi everyone, I'm studying about analog circuits and I want to know how can I plot the output waveform from a Schmitt trigger circuit:
the definition is
Vo=Vcc+ if Vin>Vh
Vo=Vcc- if Vin<VL
and it has this form:

enter image description here

more clear:
enter image description here

So the correct definition to me is this:
Vo=Vcc+ while Vin>VH until Vin<Vl then Vo=Vcc-. It is like a switch that changes the value of the output when some condition is true:
how can I express that as Mathematica function or a program?

3 Replies

I guess this is because the discretization is too coarse. If you use a finer resolution, things will improve. Try e.g.:

state = -1;
xrange = {x, 6.5, 9, .01};
dataSchmitt = Table[{x, schmitt[Sin[x]]}, Evaluate@xrange];
dataSin = Table[{x, Sin[x]}, Evaluate@xrange];

ListLinePlot[{dataSchmitt, dataSin}, GridLines -> {None, {vl, vh}}, PlotRange -> {.5, 1}, AspectRatio -> .2]

enter image description here

ADDENDUM:

As I just found out you do can use Plot - but with the proper options:

state = -1;
Plot[{schmitt[Sin[x]], Sin[x]}, {x, 0, 4 Pi}, MaxRecursion -> 0, PlotPoints -> 200]

Without recursion all data points are evaluated in order.

POSTED BY: Henrik Schachner

Jairo,

this is an interesting problem! Here is a simple outline how it could be done:

vccPlus = 1;
vccMinus = -1;
vh = 0.75;
vl = -0.75;
schmitt[x_] := Which[(state == -1) && (x > vh), (state = 1; vccPlus),
  (state == 1) && (x > vl), vccPlus,
  (state == 1) && (x < vl), (state = -1; vccMinus),
  (state == -1) && (x < vh), vccMinus]

Using this with some proper initialization:

state = -1; (* "quick and dirty" initialization - just for the example! *)
dataSchmitt = Table[{x, schmitt[Sin[x]]}, {x, 0, 4 Pi, .1}];
dataSin = Table[{x, Sin[x]}, {x, 0, 4 Pi, .1}];

ListLinePlot[{dataSchmitt, dataSin}, GridLines -> {None, {vl, vh}}]
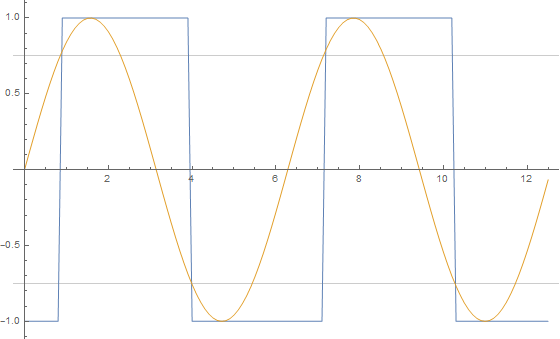
enter image description here

For this method to work it is necessary that the function points are evaluated in order (from left to right, so to speak). For this reason I generate explicit values and use ListLinePlot. Using simply

state = -1;
Plot[{schmitt[Sin[x]], Sin[x]}, {x, 0, 2 Pi}]

does not work in a clean way, because here there is no clear order of evaluation.

I am curious myself how this could be done in a better and more robust way!

POSTED BY: Henrik Schachner
Reply to this discussion
Community posts can be styled and formatted using the Markdown syntax.
Reply Preview
Attachments
Remove
or Discard