Group Abstract Group Abstract

Message Boards Message Boards

How can I do the output waveform of Schmitt trigger circuit?

Hi everyone, I'm studying about analog circuits and I want to know how can I plot the output waveform from a Schmitt trigger circuit:
the definition is
Vo=Vcc+ if Vin>Vh
Vo=Vcc- if Vin<VL
and it has this form:

enter image description here

more clear:
enter image description here

So the correct definition to me is this:
Vo=Vcc+ while Vin>VH until Vin<Vl then Vo=Vcc-. It is like a switch that changes the value of the output when some condition is true:
how can I express that as Mathematica function or a program?

3 Replies

Hi man, thanks for the method, I have a question: why exist a kind of delay in the positive Vcc, the negative Vcc is fine, it would be for the number of points? enter image description here

Thanks for help, thank you very much.

I guess this is because the discretization is too coarse. If you use a finer resolution, things will improve. Try e.g.:

state = -1;
xrange = {x, 6.5, 9, .01};
dataSchmitt = Table[{x, schmitt[Sin[x]]}, Evaluate@xrange];
dataSin = Table[{x, Sin[x]}, Evaluate@xrange];

ListLinePlot[{dataSchmitt, dataSin}, GridLines -> {None, {vl, vh}}, PlotRange -> {.5, 1}, AspectRatio -> .2]
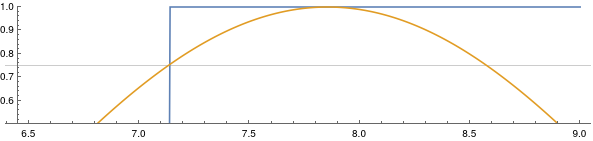
enter image description here

ADDENDUM:

As I just found out you do can use Plot - but with the proper options:

state = -1;
Plot[{schmitt[Sin[x]], Sin[x]}, {x, 0, 4 Pi}, MaxRecursion -> 0, PlotPoints -> 200]

Without recursion all data points are evaluated in order.

POSTED BY: Henrik Schachner
Reply to this discussion
Community posts can be styled and formatted using the Markdown syntax.
Reply Preview
Attachments
Remove
or Discard