Group Abstract Group Abstract

Message Boards Message Boards

0
|
7.6K Views
|
3 Replies
|
2 Total Likes
View groups...
Share
Share this post:

How to code prior close in financial data?

Posted 3 years ago

I would like to compute the range based on the high compared to the prior close. My data:

upstP = FinancialData["UPST", {2021}];
upstH = FinancialData["UPST", "High", {2021}];
upstL = FinancialData["UPST", "Low", {2021}];
upstC = FinancialData["UPST", "Close", {2021}];

I tried DatePlus[] without success

DatePlus[upstC, -1]
upstC[[1, 1]] // Normal // Short
DatePlus[upstC[[All, 1]], -1, "Day"]

I tried TimeSeriesShift[] without success

TimeSeriesThread[{1, -1} . # &, {upstC, TimeSeriesShift[upstC, -1]}] //
   Normal // Short

and some other variations that I can no longer remember. How would I subtract yesterday's close from today's high -- continuous???

POSTED BY: Raymond Low
3 Replies

... high compared to the prior close....

I am not sure what you mean and I do not know anything about stock market (and do feel a very strong aversion to this stuff!), but for the sake of the syntax:

DateListPlot[upstH/TimeSeriesShift[upstC, Quantity[1, "Days"]], 
 ImageSize -> Large, Filling -> Bottom, PlotRange -> All]

enter image description here

POSTED BY: Henrik Schachner
Posted 3 years ago

Thank you Nicholas,

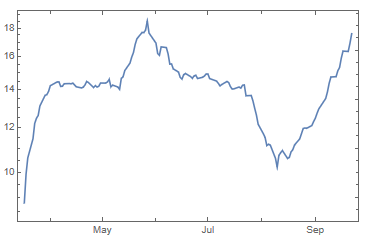
I tried working with your code and got closer to my target. I managed a 50 day moving average, which was interesting on upst, and questionable, seems like there is a mistake here?? Unless one or two very large jumps are moving through the average causing the distortion??

data = FinancialData["UPST", "OHLC", {2021}];

diff50HL = 
  MovingAverage[
   MovingMap[#Values[[-1, 2]] - #Values[[1, 3]] &, data, 
    Quantity[2, "Events"]], 50];
DateListLogPlot[diff50HL]

enter image description here

I got the differences between the high & low, the high & close, and the low & close --

diffHL = MovingMap[#Values[[-1, 2]] - #Values[[1, 3]] &, data, 
   Quantity[2, "Events"]];
diffHC = MovingMap[#Values[[-1, 2]] - #Values[[1, 4]] &, data, 
   Quantity[2, "Events"]];
diffLC = MovingMap[#Values[[-1, 3]] - #Values[[1, 4]] &, data, 
   Quantity[2, "Events"]];

Threaded the three differences together to determine the maximum difference --

diffT = Transpose[{Flatten@diffHL["Values"], 
    Flatten@Abs[diffHC["Values"]], Flatten@Abs[diffLC["Values"]]}] ;
diffMax = Max[#] & /@ diffT ;

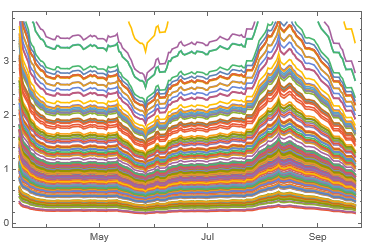
And then I got stuck, try as I am, hours later, I still was not able to compute a moving percentage of the maximum difference and 50 day moving average of the high-low (range). The only result I got was diffidently not what I wanted

mm = MovingAverage[diffMax/diff50HL, 1];
DateListPlot[mm]

enter image description here

Everything else I tried crashed and burned. Thank you for any help that you can provide.

POSTED BY: Raymond Low
Reply to this discussion
Community posts can be styled and formatted using the Markdown syntax.
Reply Preview
Attachments
Remove
or Discard