Thank you Nicholas,
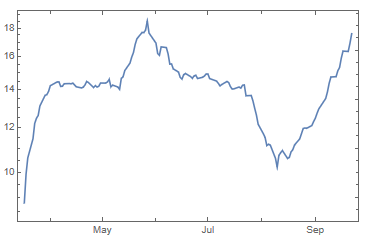
I tried working with your code and got closer to my target. I managed a 50 day moving average, which was interesting on upst, and questionable, seems like there is a mistake here?? Unless one or two very large jumps are moving through the average causing the distortion??
data = FinancialData["UPST", "OHLC", {2021}];

diff50HL =
  MovingAverage[
   MovingMap[#Values[[-1, 2]] - #Values[[1, 3]] &, data,
    Quantity[2, "Events"]], 50];
DateListLogPlot[diff50HL]

I got the differences between the high & low, the high & close, and the low & close --
diffHL = MovingMap[#Values[[-1, 2]] - #Values[[1, 3]] &, data,
   Quantity[2, "Events"]];
diffHC = MovingMap[#Values[[-1, 2]] - #Values[[1, 4]] &, data,
   Quantity[2, "Events"]];
diffLC = MovingMap[#Values[[-1, 3]] - #Values[[1, 4]] &, data,
   Quantity[2, "Events"]];
Threaded the three differences together to determine the maximum difference --
diffT = Transpose[{Flatten@diffHL["Values"],
    Flatten@Abs[diffHC["Values"]], Flatten@Abs[diffLC["Values"]]}] ;
diffMax = Max[#] & /@ diffT ;
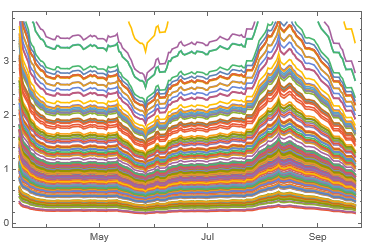
And then I got stuck, try as I am, hours later, I still was not able to compute a moving percentage of the maximum difference and 50 day moving average of the high-low (range). The only result I got was diffidently not what I wanted
mm = MovingAverage[diffMax/diff50HL, 1];
DateListPlot[mm]

Everything else I tried crashed and burned. Thank you for any help that you can provide.