I think there is an error in the Mathematica notebook attached to the original question -- fun5 is defined with lower case variables (x and y) instead of upper case variables (X and Y) as the rest of the functions fun1, fun2, etc.
You can use NIntegrate to verify the implementations in this project. Below is some code that might help.
Clear[fun1, fun2, fun3, fun4, fun5]
fun1[X_, Y_] := X^2 + Y^3;
fun2[X_, Y_] := X^2/4 + Y^2;
fun3[X_, Y_] := X - Y^2;
fun4[X_, Y_] := Y + 3 X^2;
fun5[x_, y_] := Cos[y^2] + E^-x^2;
First let us use NIntegrate's MonteCarlo integration method:
In[468]:= NIntegrate[
Boole[fun1[X, Y] >= 4 || fun2[X, Y] >= 2 || fun3[X, Y] >= 1 ||
fun4[X, Y] <= -1/4 || fun5[X, Y] <= 0], {X, -2, 2}, {Y, -2, 2}, {Z,
0, 2}, Method -> "MonteCarlo"]
Out[468]= 16.1861
The result is close to the result given by the default non-Monte Carlo integration method:
In[463]:= NIntegrate[
Boole[fun1[X, Y] >= 4 || fun2[X, Y] >= 2 || fun3[X, Y] >= 1 ||
fun4[X, Y] <= -1/4 || fun5[X, Y] <= 0], {X, -2, 2}, {Y, -2, 2}, {Z,
0, 2}, PrecisionGoal -> 2]
Out[463]= 16.2698
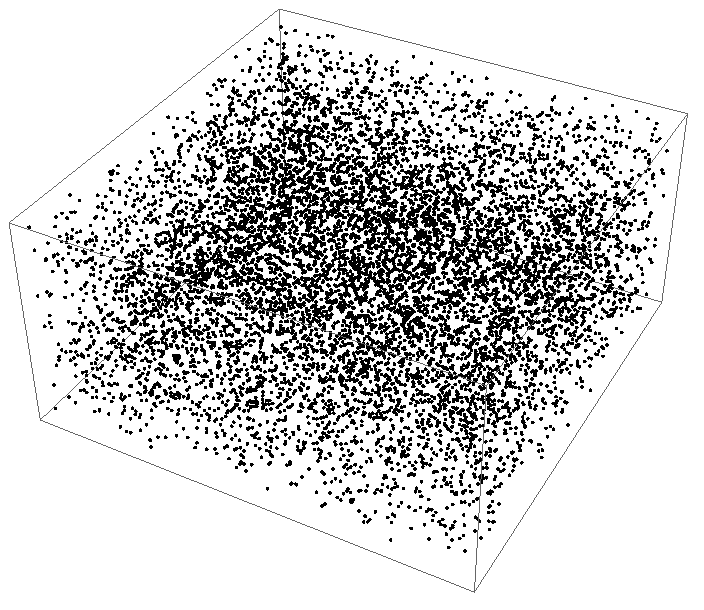
Here is how we can see the sampling points:
res = Reap[
NIntegrate[
Boole[fun1[X, Y] >= 4 || fun2[X, Y] >= 2 || fun3[X, Y] >= 1 ||
fun4[X, Y] <= -1/4 || fun5[X, Y] <= 0], {X, -2, 2}, {Y, -2,
2}, {Z, 0, 2}, Method -> "MonteCarlo",
EvaluationMonitor :> Sow[{X, Y, Z}]]];
Graphics3D[Point[res[[2]]]]

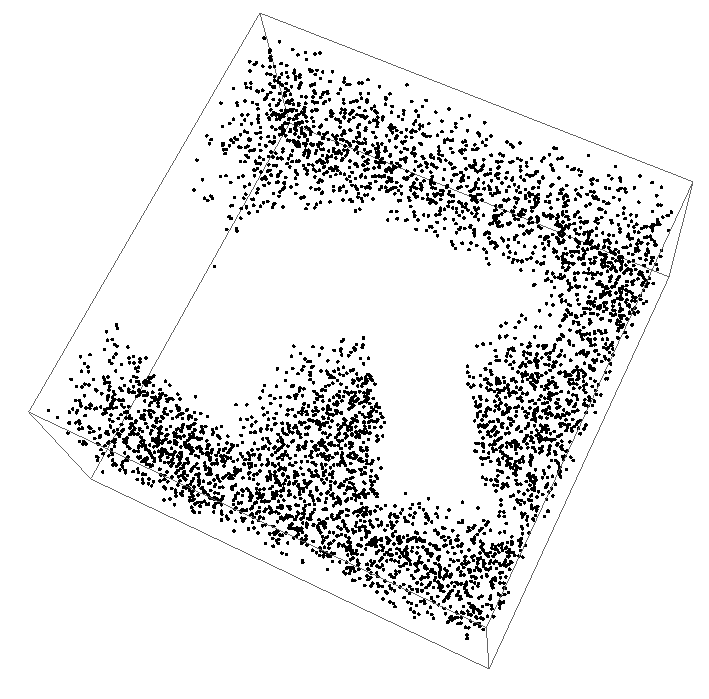
Using Select we can plot the points for which the condition given to Boole gives True:
Graphics3D[
Point[Select[res[[2, 1]],
Block[{X, Y, Z}, {X, Y, Z} = #;
fun1[X, Y] >= 4 || fun2[X, Y] >= 2 || fun3[X, Y] >= 1 ||
fun4[X, Y] <= -1/4 || fun5[X, Y] <= 0] &]]]
