Message Boards Message Boards

3
|
3164 Views
|
2 Replies
|
8 Total Likes
View groups...
Share
Share this post:

Styling of boundaries in ParametricPlot3D[ ] ?

Posted 2 years ago

I am trying to get control over the different parts of the boundaries in a Parametric3D as here:

ParametricPlot3D[{v, Cos[t], Sin[t]}, {t, 0, 2 Pi}, {v, -3, 3}, 
 PerformanceGoal -> "Quality", 
 PlotStyle -> {FaceForm[Directive[Opacity[1], Green], 
    Directive[Opacity[1], Lighter[Magenta, .25]]]}, Boxed -> False, 
 Axes -> False, Mesh -> None, 
 RegionFunction -> Function[{x, y, z}, x^2 + z^2 > .35], 
 BoundaryStyle -> AbsoluteThickness[3]]

enter image description here

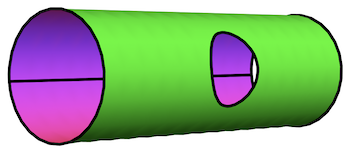
I want to keep only the boundary in the circular hole cut by another cylinder and get rid of the two extreme circular boundaries and the horizontal line boundary on the main cylinder.

My question: is there a way to control separate parts of these 3 boundary sections and style (or delete) them differently?

POSTED BY: Erik Mahieu
2 Replies
Posted 2 years ago

Works perfectly. Got confused between Mesh and Boundary but now I even understand the why of your "Mesh->{{.01}}" ! Thanks!

POSTED BY: Erik Mahieu

I think you just have to specify the boundary you need via a different mechanism. For more details see this and this. For example:

ParametricPlot3D[{v,Cos[t],Sin[t]},{t,0,2 Pi},{v,-3,3},
PlotPoints->30,Boxed->False,Axes->False,
PlotStyle->{
    FaceForm[Directive[Opacity[1],Green],
    Directive[Opacity[1],Lighter[Magenta,.25]]]},
RegionFunction->Function[{x,y,z},x^2+z^2>.35],
Mesh -> {{.01}},
MeshStyle->Directive[Thickness[.01],Black],
MeshFunctions->{Function[{x,y,z},x^2+z^2-.35]}]

enter image description here

POSTED BY: Vitaliy Kaurov
Reply to this discussion
Community posts can be styled and formatted using the Markdown syntax.
Reply Preview
Attachments
Remove
or Discard

Group Abstract Group Abstract