Group Abstract Group Abstract

Message Boards Message Boards

3
|
4.7K Views
|
2 Replies
|
8 Total Likes
View groups...
Share
Share this post:

Styling of boundaries in ParametricPlot3D[ ] ?

Posted 4 years ago
POSTED BY: Erik Mahieu
2 Replies
Posted 4 years ago

Works perfectly. Got confused between Mesh and Boundary but now I even understand the why of your "Mesh->{{.01}}" ! Thanks!

POSTED BY: Erik Mahieu

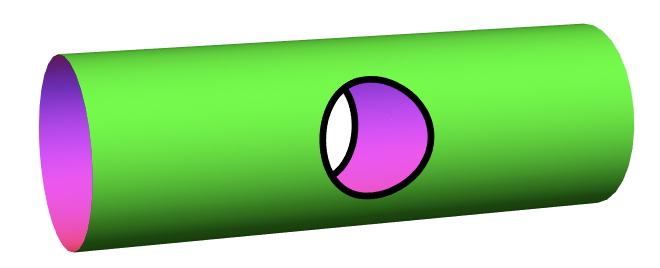
I think you just have to specify the boundary you need via a different mechanism. For more details see this and this. For example:

ParametricPlot3D[{v,Cos[t],Sin[t]},{t,0,2 Pi},{v,-3,3},
PlotPoints->30,Boxed->False,Axes->False,
PlotStyle->{
    FaceForm[Directive[Opacity[1],Green],
    Directive[Opacity[1],Lighter[Magenta,.25]]]},
RegionFunction->Function[{x,y,z},x^2+z^2>.35],
Mesh -> {{.01}},
MeshStyle->Directive[Thickness[.01],Black],
MeshFunctions->{Function[{x,y,z},x^2+z^2-.35]}]

enter image description here

POSTED BY: Vitaliy Kaurov
Reply to this discussion
Community posts can be styled and formatted using the Markdown syntax.
Reply Preview
Attachments
Remove
or Discard