Group Abstract Group Abstract

Message Boards Message Boards

0
|
2.9K Views
|
2 Replies
|
1 Total Like
View groups...
Share
Share this post:

How to draw scatter data with auto-offset for points?

Hello,

It is my first post in the Wolfram community, please excuse any mistake if there is any.

I want to plot scatter plot instead of bargraphs. The samples could be found in the following papers:

Figure 1c and 2b of Biomaterials2020 Figure 2b and 4c of Natue Comunacations2021

Please let me know how it would be possible to do it.

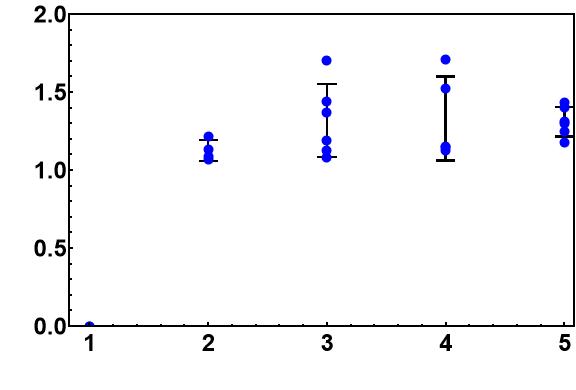
I used couple of ListPlot[] and then Show[] to make the following, but I think there would be a better way to do this.

enter image description here

POSTED BY: Zaman Ataie
2 Replies

Welcome to Wolfram Community!
Please make sure you know the rules: https://wolfr.am/READ-1ST

Your post is too vague. Please describe your subject extensively providing your code you used to produce this output. This can speed up the process of answering your question.

The rules above explain several ways to include your well formatted code.

POSTED BY: EDITORIAL BOARD
Reply to this discussion
Community posts can be styled and formatted using the Markdown syntax.
Reply Preview
Attachments
Remove
or Discard