Hello,
It is my first post in the Wolfram community, please excuse any mistake if there is any.
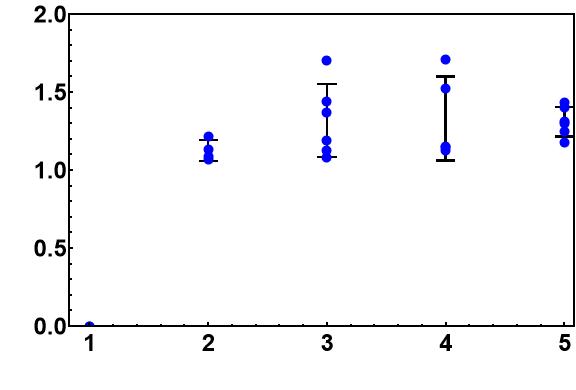
I want to plot scatter plot instead of bargraphs. The samples could be found in the following papers:
Figure 1c and 2b of Biomaterials2020 Figure 2b and 4c of Natue Comunacations2021
Please let me know how it would be possible to do it.
I used couple of ListPlot[] and then Show[] to make the following, but I think there would be a better way to do this.
