Message Boards Message Boards

[WSS22] Graph tilings and constrained network systems

POSTED BY: Theodore Mollano
4 Replies

Hey dean- wow nice to hear from you! Wow great skills with the bitmap, I can tell Map[] is among your favorite functions! Nice- yes this little project could for sure be expanded one day… 3D visualization of token event graphs would certainly be cool! I have always wondered how to make these…

All the best, Theodore

POSTED BY: Theodore Mollano

@Theodore Mollano generalize this it's like the thing that you do with the graph tilings.

My favorite function of all time is the token event graph like @Richard Charette. I used to like the token event graph.

graph = CompleteGraph[65,
   VertexLabels -> Placed["Name", Center],
   EdgeStyle -> 
    Thread[EdgeList[graph] -> 
      ColorData["SunsetColors"] /@ Rescale[Range[EdgeCount[graph]]]],
   VertexSize -> 0];
highlightedGraph = SetProperty[
   graph,
   {EdgeStyle -> Thread[
      RandomSample[EdgeList[graph], Floor[EdgeCount[graph]/100]] -> 
       Directive[Thick, Lighter[Pink]]
      ]}];
tokenEventGraph = ResourceFunction[
    ResourceObject[<|"Name" -> "TwoWayStringTokenEventGraph",
      "UUID" -> "6efe33fc-c0fa-4d4f-8198-1e9db29ac03e",
      "ResourceType" -> "Function", 
      "ResourceLocations" -> {CloudObject[
         "https://www.wolframcloud.com/obj/wolframphysics/Resources/\
6ef/6efe33fc-c0fa-4d4f-8198-1e9db29ac03e"]}, "Version" -> None,
      "DocumentationLink" -> 
       URL["https://www.wolframcloud.com/obj/wolframphysics/\
TwoWayStringTokenEventGraph"],
      "ExampleNotebookData" -> Automatic, 
      "FunctionLocation" -> 
       CloudObject[
        "https://www.wolframcloud.com/obj/wolframphysics/Resources/\
6ef/6efe33fc-c0fa-4d4f-8198-1e9db29ac03e/download/DefinitionData"], 
      "ShortName" -> "TwoWayStringTokenEventGraph",
      "SymbolName" -> 
       "FunctionRepository`$6efe33fcc0fa4d4f81981e9db29ac03e`\
TwoWayStringTokenEventGraph"|>]][
   Thread[UndirectedEdge @@@ EdgeList[graph] -> StringJoin[
      RandomChoice[{"Dreamy", "Sunset", "Honey", "Melody", 
        "Butterfly"}, 2]]],
   "Sorting" -> True,
   VertexSize -> .75,
   Sequence["EventDeduplication" -> True,
    "TokenLabeling" -> False]];
HighlightGraph[highlightedGraph, tokenEventGraph]

My favorite function is Map[].

HighlightGraph

Okay so there's these tilings and then, @Theodore Mollano when you walk in it is like heaven and Earth. I always wondered how to make 3d token event graphs.

POSTED BY: Dean Gladish

@Theodore Mollano I see your article exploring the graph tilings, and the constrained network systems. It almost makes me want to use Graph3D, to separate different evolution paths in 3D space.

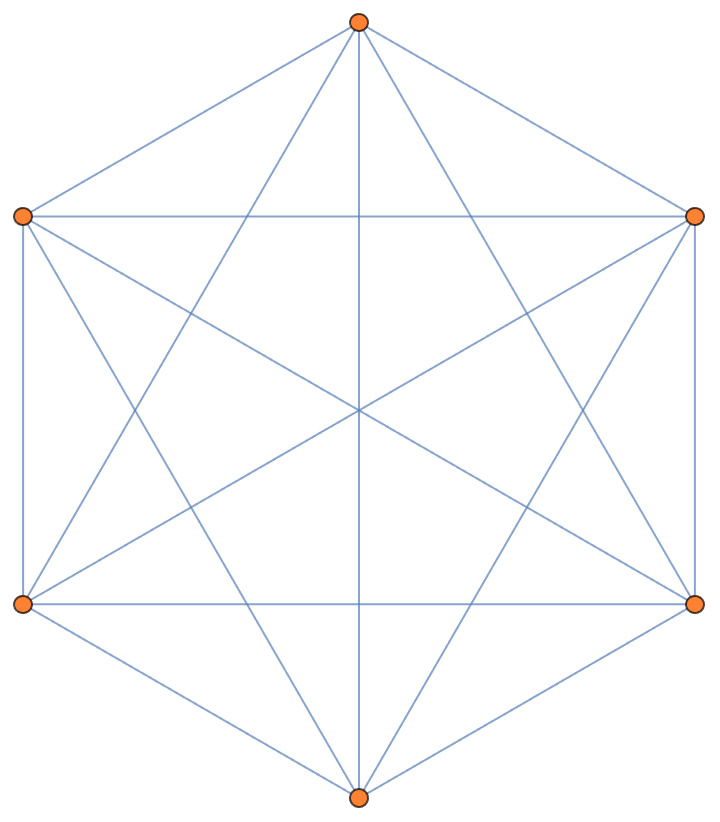
Graph[GraphUnion @@ generateSimpleTemplate[{3}, 6], 
 VertexStyle -> RandomColor[RGBColor[1, 0.51, 0.2]], 
 EdgeStyle -> RGBColor[0.331, 0.4884, 0.7223]]

With @James Boyd this is easy. There's an old Ruliad proverb that whenever you're working with big graphs, when you're dancing with the Ruliad you should bitmap.

Generate Simple Template

Because graph tilings have important relations to Combinatorics, Graph Theory, and Computer science, and this article was Space & Time.
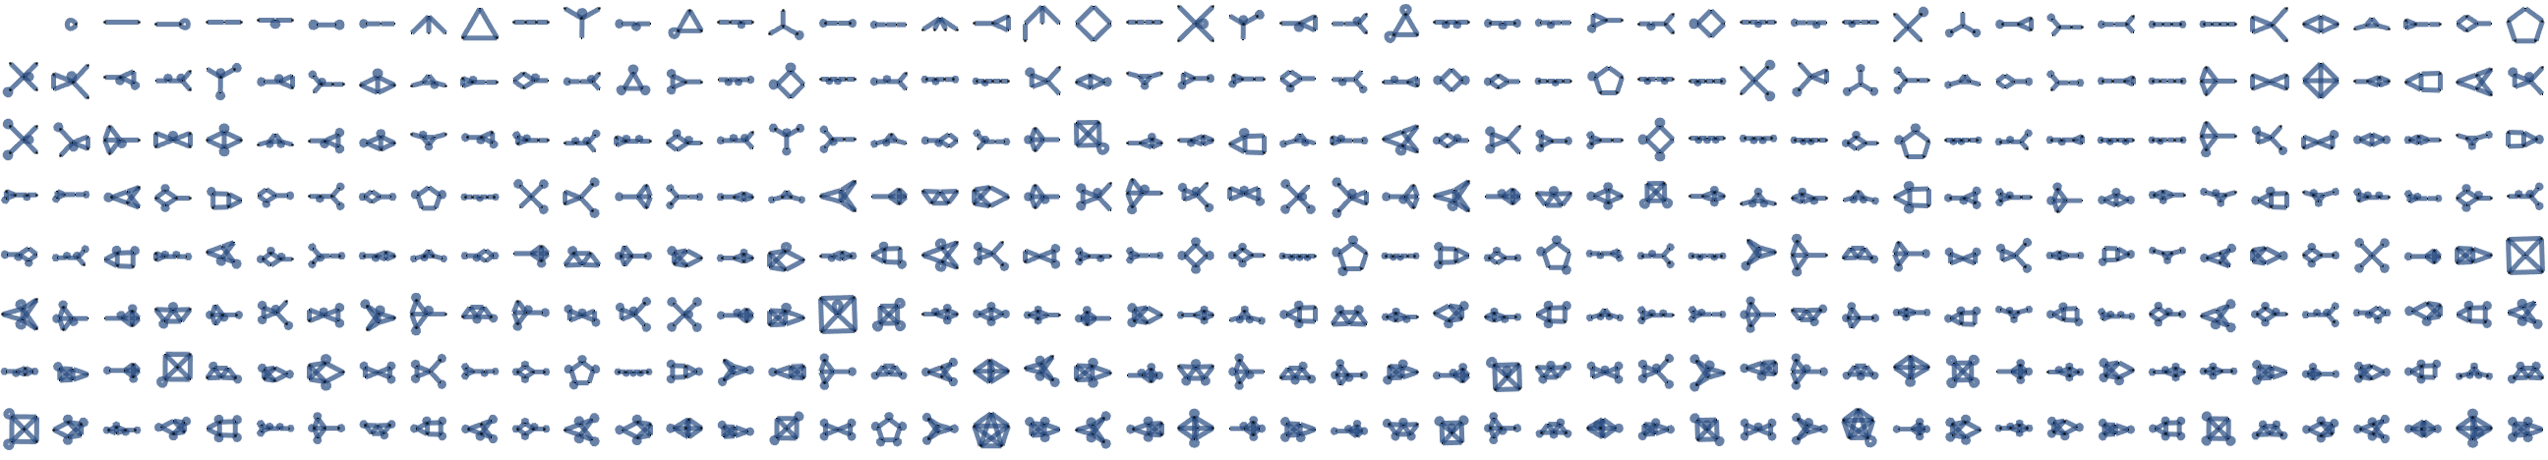
With[{graphstwo = 
   Select[DeleteDuplicates[
     Graph[VertexList@#, #, 
        VertexStyle -> {RandomColor[], EdgeForm[Black], 
          AbsolutePointSize[15]}, 
        EdgeStyle -> {RandomColor[], AbsoluteThickness[2.5]}] & /@ 
      Subsets[EdgeList[
        GraphUnion[CompleteGraph[5], 
         Graph[{1 \[UndirectedEdge] 1, 2 \[UndirectedEdge] 2, 
           3 \[UndirectedEdge] 3, 4 \[UndirectedEdge] 4, 
           5 \[UndirectedEdge] 5}]]]], IsomorphicGraphQ], 
    ConnectedGraphQ]}, 
 Grid[Partition[graphstwo, 50], Frame -> None, 
  ItemSize -> {1.5, 1.5}]]

Offer us a glimpse into statistical and algorithmic connections, and we have got the template tiling.

graphstwo

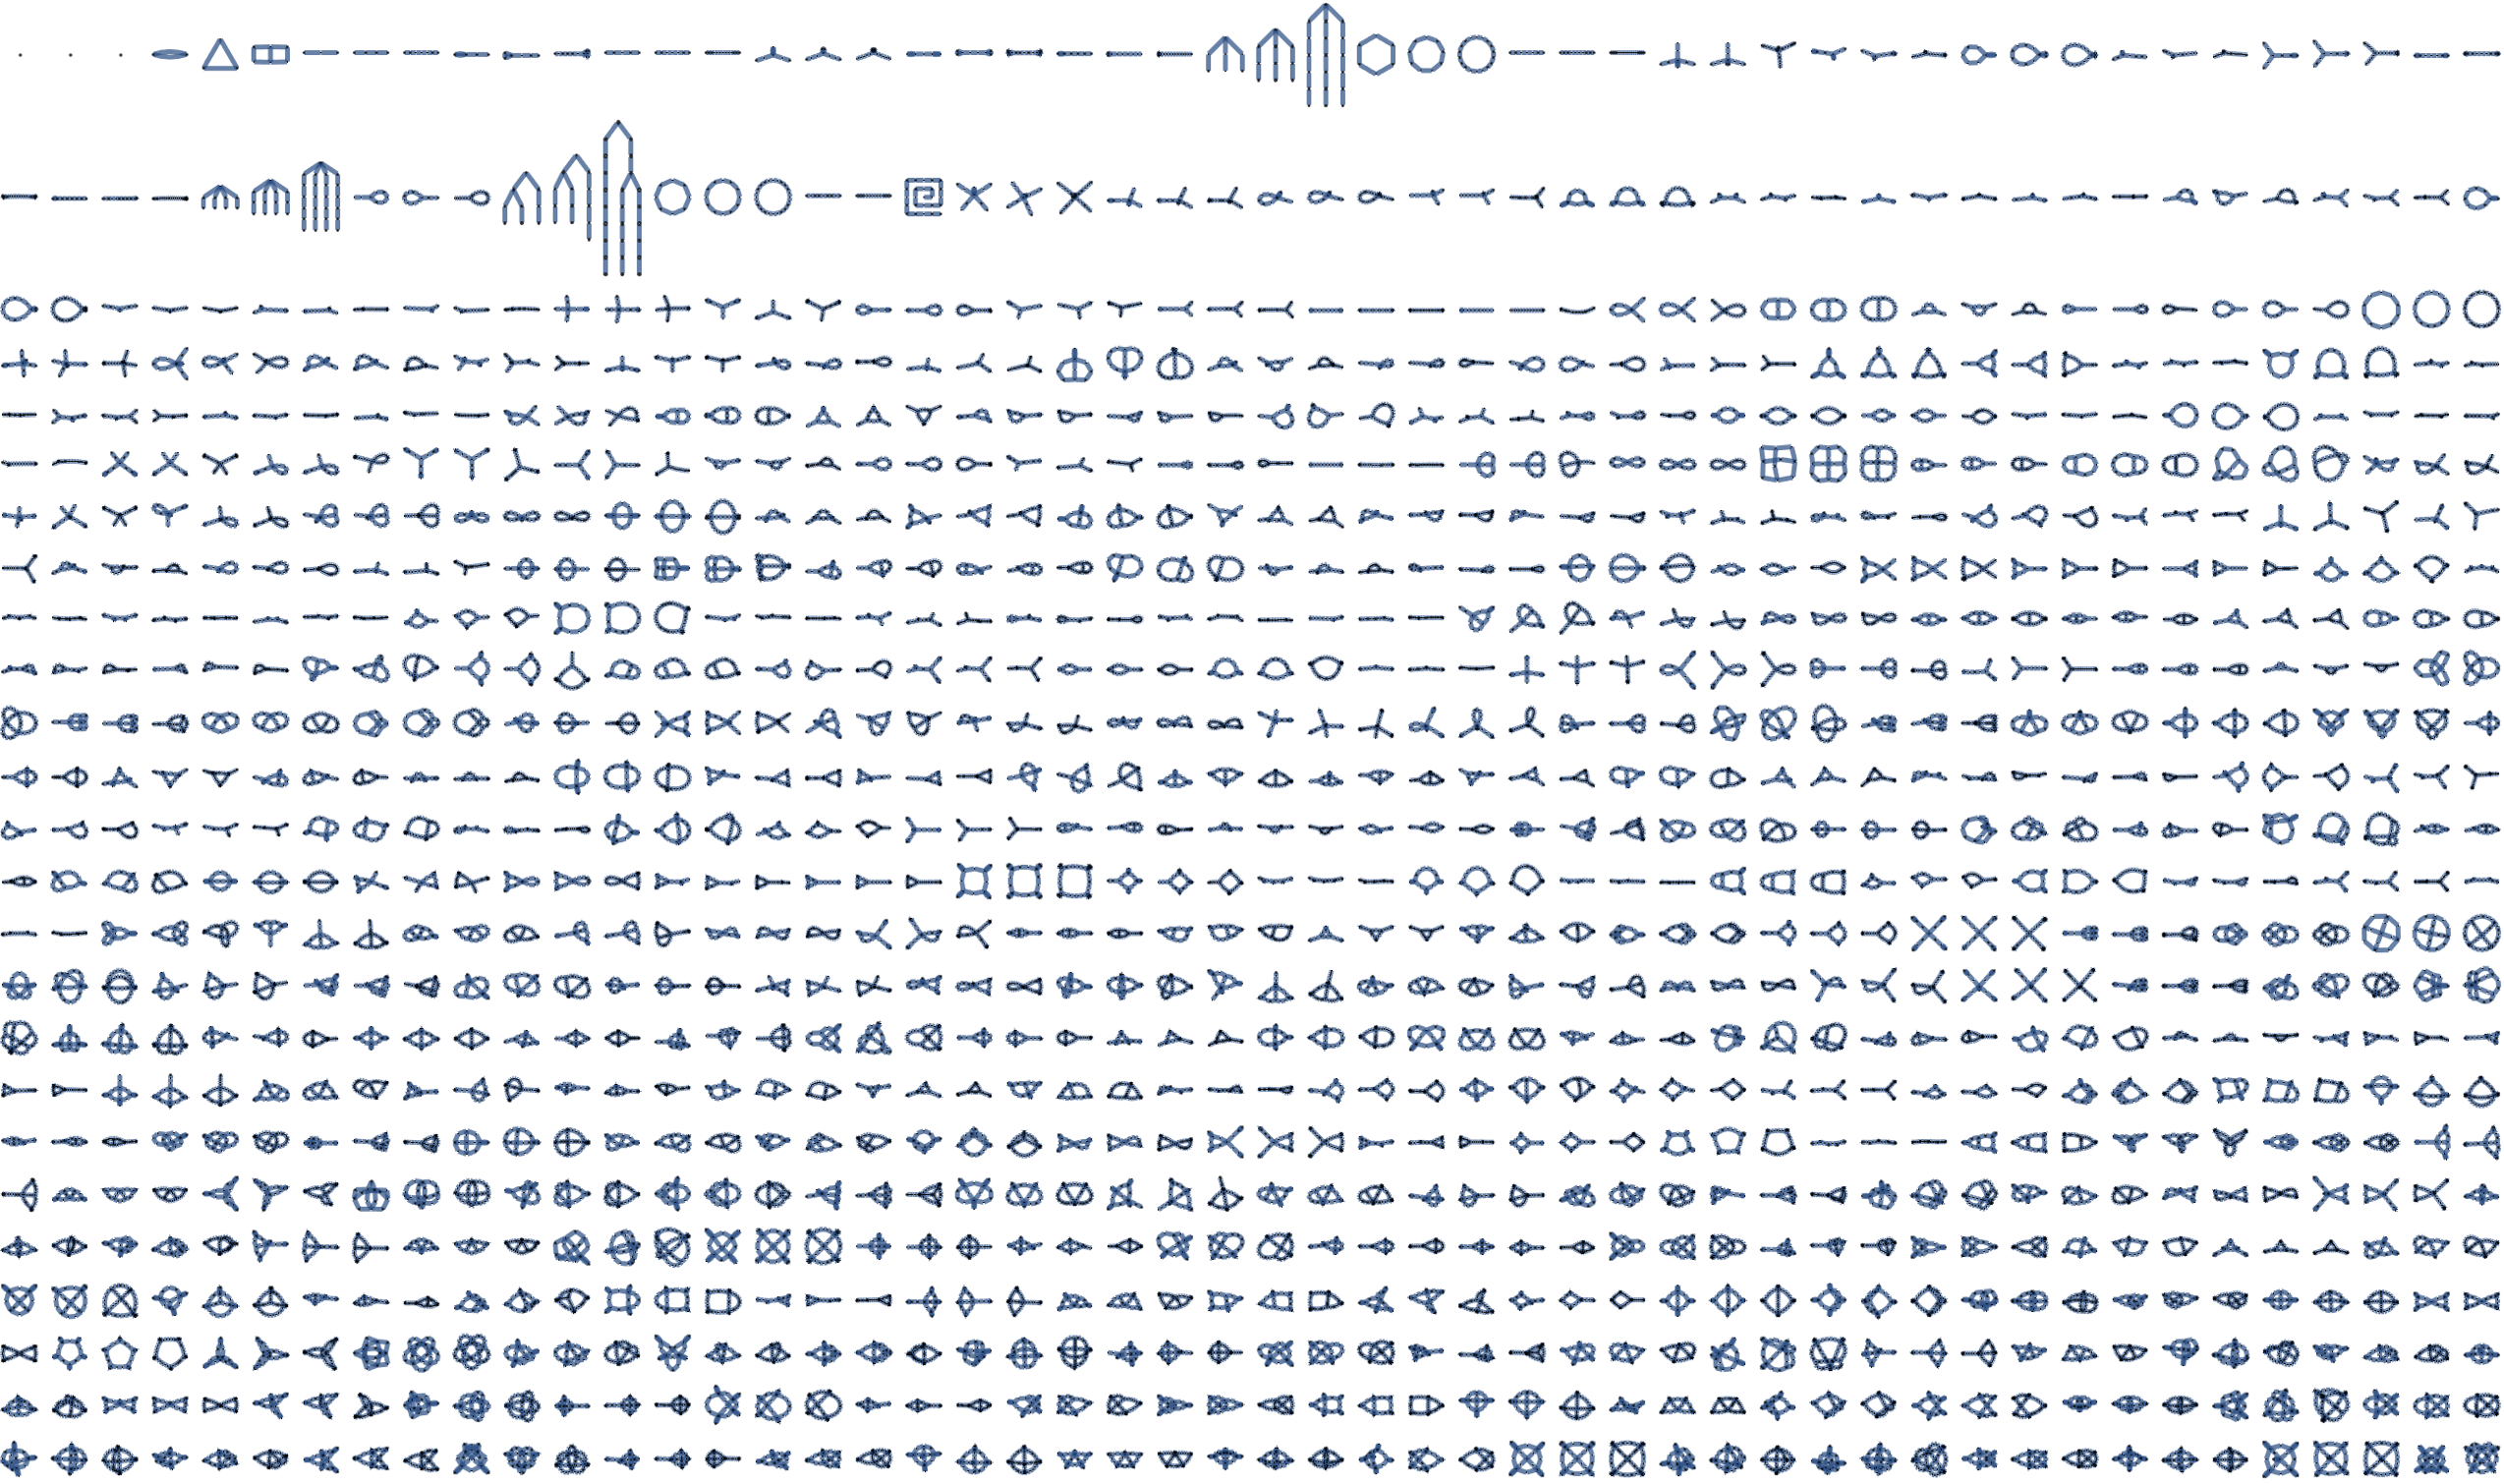
These are illustrative examples of the k-valent tilings.

Grid[Partition[
  Flatten[Map[Map[NeighborhoodGraph[#, 1, 1] &, #] &, 
    Map[{doubleEdge[#], tripleEdge[#], tripleEdge[doubleEdge[#]]} &, 
     graphstwo], {2}]], 50], Frame -> None, ItemSize -> {1.5, 1.5}]

And the @Stephen Wolfram future problem determines the largest graph that can be formed using a simple set of templates.

Neighborhood Graph

This is such a good framework for project culmination.

POSTED BY: Dean Gladish

enter image description here -- you have earned Featured Contributor Badge enter image description here Your exceptional post has been selected for our editorial column Staff Picks http://wolfr.am/StaffPicks and Your Profile is now distinguished by a Featured Contributor Badge and is displayed on the Featured Contributor Board. Thank you!

POSTED BY: Moderation Team
Reply to this discussion
Community posts can be styled and formatted using the Markdown syntax.
Reply Preview
Attachments
Remove
or Discard

Group Abstract Group Abstract