It's, this idea of universal computation that you can kind of emulate any other computer when the other computer is doing anything that the other computer can do, emulation relies on the idea that you can look at a lot of initial conditions; you can set up initial conditions that has the property that it's going to emulate anything that that other computer can do. Now, this principle of computational equivalence of mine goes a bit further than that, and it describes what you can do with particular initial conditions; the computations that get done even with particular initial conditions are really sophisticated computations. One really starts to think about the idea of computational irreducibility--do you really need to do that computation step by step, or is there another computer that can jump in and take a lot of steps; the notion that there is a hard computation that there is going on, what does it mean for computation to be happening in things; you can think of them as being mind-like in a certain sense, in a sense that our minds are working out what will happen by going step by step and neurons firing away and these systems are also doing that, and there's this question of whether the computations going on in our minds are sophisticated or not, and this big principle of computational equivalence are, from a sort of zoomed out computational sense, the computations going on in our minds are no more sophisticated than particles bouncing around. That's when you get into sort of the exploration of three-body dynamics involving a star, planet, and moon by broadening the investigation to include higher-order N-body systems, collision detection, and variable eccentricities !
Abstract:
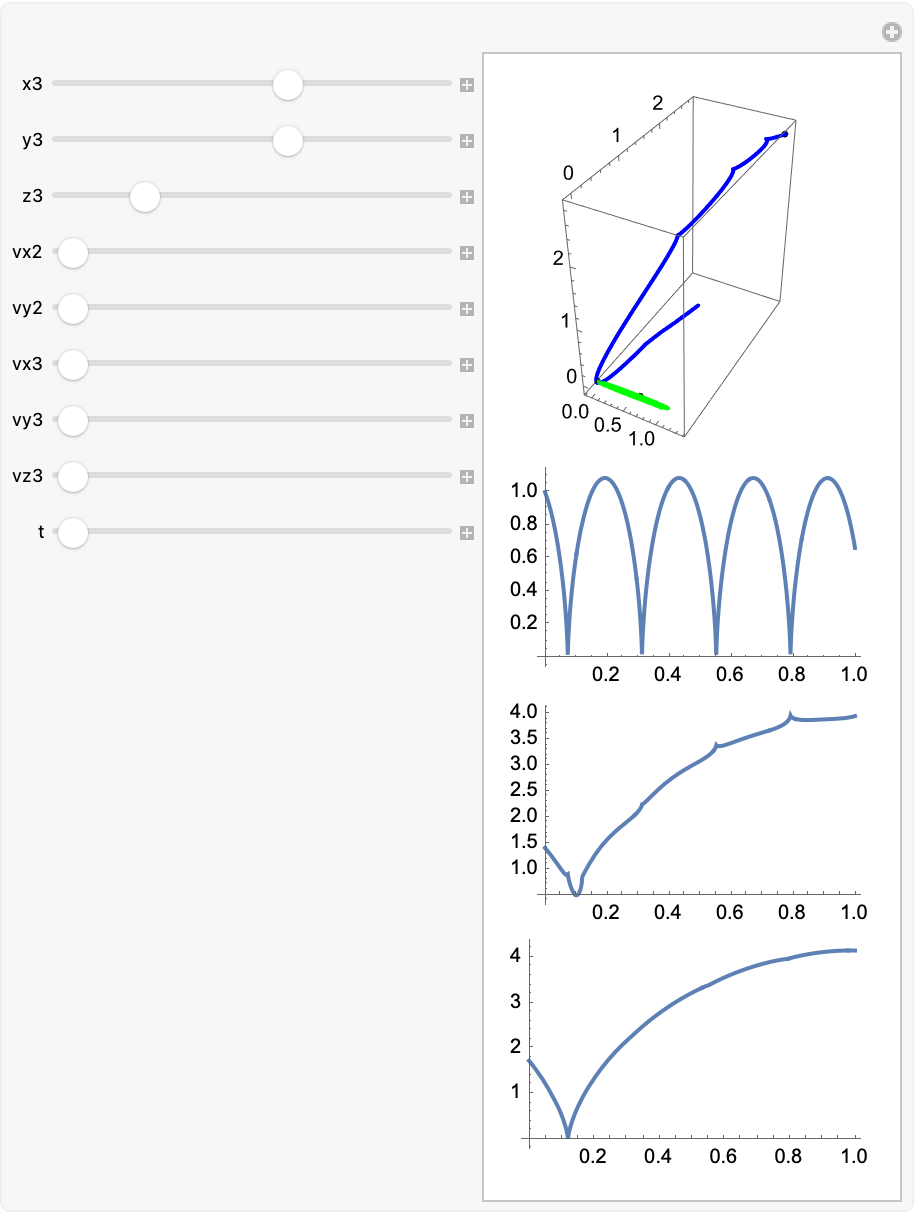
Manipulate[
 NBodyVisualize[
  3, {m1, m2,
   m3}, {{0, 0, 0}, {1, 0, 0}, {x3, y3, z3}}, {{0, 0, 0}, {vx2, vy2,
    0}, {vx3, vy3, vz3}}, {0, t}], {{m1, 100}, 10, 1000,
  Appearance -> "Labeled"}, {{m2, 10}, 1, 100,
  Appearance -> "Labeled"}, {{m3, 0.1}, 0.001, 10, 0.001,
  Appearance -> "Labeled"}, {{x3, 1.1}, -5, 5,
  Appearance -> "Labeled"}, {{y3, 0}, -5, 5,
  Appearance -> "Labeled"}, {{z3, 0}, 0, 5,
  Appearance -> "Labeled"}, {{vx2, 0}, -10, 10,
  Appearance -> "Labeled"}, {{vy2, 10}, -100, 100,
  Appearance -> "Labeled"}, {{vx3, 0}, -100, 100,
  Appearance -> "Labeled"}, {{vy3, 15}, -100, 100,
  Appearance -> "Labeled"}, {{vz3, 0}, -100, 100,
  Appearance -> "Labeled"}, {t, 0.5, 10, 0.1,
  Appearance -> "Labeled"}, SaveDefinitions -> True]
Now with that NBodyVisualize function there are new examples and code snippets that illustrate the advanced techniques of modernized computation such as random generation of initial conditions and statistical analyses of orbital behaviors. You might need to check the design elements that are showing up and or look at it in incognito mode in order to demonstrate how Wolfram Language and related tools can be "combined" with a top-down approach of theoretical formation, of a "resilient" framework through the looking glass for studying stability and or chaos in gravitationally bound systems.
m2Value = 10;
m3Value = 0.1;
x3Val = 1.1;
y3Val = 0;
z3Val = 0;
vx2Val = 0;
vy2Val = 10;
vx3Val = 0;
vy3Val = 15;
vz3Val = 0;
tEnd = 5;
m1Start = 10;
m1End = 1000;
m1Step = 100;
frames =
  Table[NBodyVisualize[
    3, {mVal, m2Value,
     m3Value}, {{0, 0, 0}, {1, 0, 0}, {x3Val, y3Val, z3Val}}, {{0, 0,
      0}, {vx2Val, vy2Val, 0}, {vx3Val, vy3Val, vz3Val}}, {0,
     tEnd}], {mVal, m1Start, m1End, m1Step}];
Export["NBody_m1_Sweep.gif", frames, "DisplayDurations" -> 0.5];
Print["Animation has finally been saved as NBody_m1_Sweep.gif in the \
present directory."]
What's important about this notion of computational irreducibility and this idea that there's computation going on in all these different parts of the universe is that we're quite computationally bounded; we can't trace all of those details with what's happening in the computational universe, we can only sample some compressed version of that. The fact that we are computationally bounded but what's going on underneath is full computation--unbounded, that interplay turns out to lead us to the core laws of physics that got discovered in the 20th century.
Introduction
The second law of thermodynamics is a big story that's been exciting for me in the past few years, that this fact about us as computationally bounded as compared to this irreducible computation that happens in other parts of the world, natural laws to be the way that we discovered those natural laws to be. So that's a lot bit philosophical response but it's an interesting question--when does one become computational? As soon as you reach this point where running over all these initial conditions you would be doing universal computation, that's a question of yes,
NBodyVisualizeAnimation[data_, {t1_, t2_, dt_}] :=
 Module[{dataCentered, plotData, planetColors = {Red, Green, Blue}},
  dataCentered = (Table[
      data[i, "Position"][#] - data[1, "Position"][#], {i, 1,
       Length[data]}]) &;
  Graphics3D[{Table[{planetColors[[i]],
      Line[Table[dataCentered[t][[i]], {t, t1, t2, dt}]],
      PointSize[0.02], Point[dataCentered[t2][[i]]]}, {i, 1,
      Length[data]}]}, PlotRange -> All, Axes -> True,
   BoxRatios -> {1, 1, 1}, AxesLabel -> {"x", "y", "z"}]]
NObj = 3;
masses = {100, 10, 1};
initialPositions = {{0, 0, 0}, {1, 0, 0}, RandomReal[{-1, 1}, 3]};
initialVelocities = {{0, 0, 0}, {0.1, 0, 0},
   RandomReal[{-0.1, 0.1}, 3]};
simulationTime = 2;
data = NBodySimulation["InverseSquare",
   Table[<|"Mass" -> masses[[i]], "Position" -> initialPositions[[i]],
      "Velocity" -> initialVelocities[[i]]|>, {i, 1, NObj}],
   simulationTime];
frames =
  Table[NBodyVisualizeAnimation[data, {0, t, 0.01}], {t, 0.01,
    simulationTime, 0.01}];
ListAnimate[frames]
You'd be doing computation there. it's a tiny subset you could define that to be a computation, I think that's a small subset and by the way as we advance, as we build out the things that we understand we're expanding this domain of what computations we can consider sort of accessible to the human narrative. Computational language is really a story of defining certain words that represent computational concepts and as we expand Wolfram Language, we're gradually expanding the domain of what is computational, we can bring into human narrative. The classical narrative being that the three-body problem has provided a testing ground for concepts of orbital stability, chaos, and long-term behavior in celestial mechanics.. You can, it's always like the original analysis that we get it's like the uSGS it's like the Aga Khan thing; small changes in the moon's initial conditions could have a profound effect on whether the moon stays bound or escapes. Building on the concepts of semi-major axis adjustments, position dependence, and mass ratios, we can now extend the study to include additional bodies, random initializations, eccentric orbits, and collision detection(s).
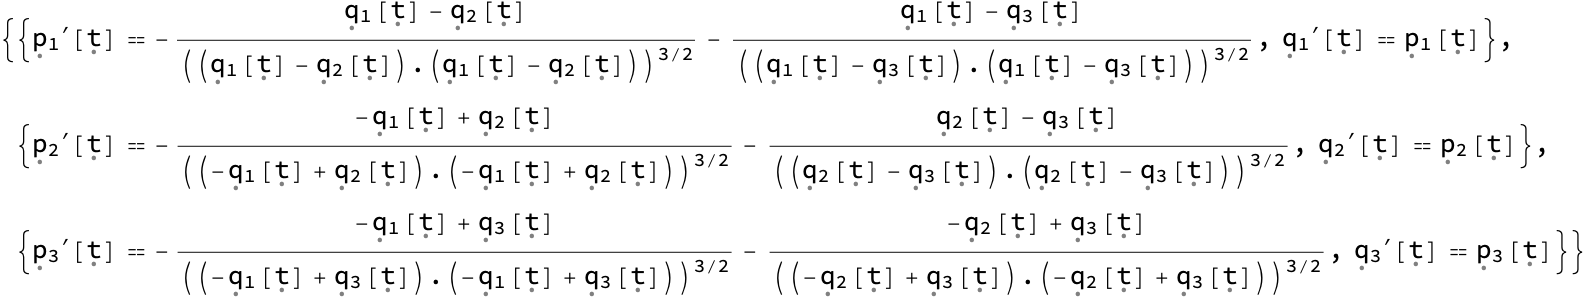
NBodySimulation[
"InverseSquare", {<|"Mass" -> 1, "Position" -> {0, 0, 0},
"Velocity" -> {0, 0, 0}|>, <|"Mass" -> 1, "Position" -> {1, 1, 1},
"Velocity" -> {0, 0, 0}|>, <|"Mass" -> 1,
"Position" -> {1, 1, 0}, "Velocity" -> {0, 0, 0}|>},
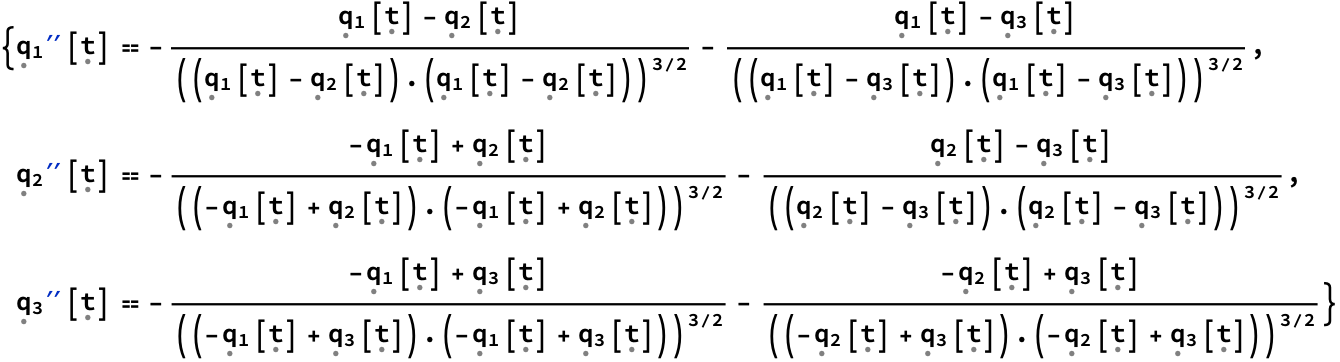
1]["HamiltonEquations"]
Manipulate[
NBodyVisualize[
3, {100, 10,
1}, {{0, 0, 0}, {1, 0, 0}, {x3, y3, z3}}, {{0, 0, 0}, {vx2, vy2,
0}, {vx3, vy3, vz3}}, {0, t}], {{x3, 1}, -5, 5}, {{y3, 1}, -5,
5}, {{z3, 1}, 0, 5}, {vx2, -5, 5}, {vy2, 0, 5}, {vx3, -5,
5}, {vy3, -5, 5}, {vz3, -5, 5}, {t, 1, 10}, SaveDefinitions -> True]
Additional Theoretical Background
2.1 Variable Eccentricity and Perturbations
In classical celestial mechanics, eccentricity plays a key role in defining an orbit's shape. Even modest perturbations in the "biosphere" in the eccentricity can cause large variations in how a body's orbit evolves, especially when multiple interacting masses are involved. That's why when you see Wolfram you just pass through him it's like pulling out the NES cartridge ever so slightly more (but not all the way) to just get a glimpse of what celestial mechanics is meant to be. We can't interact with him whatsoever but it's okay because we did it all computationally. All we can do is observe both ways.
2.2 Collisions and Their Significance
In classical celestial mechanics, collision dynamics, though often simplified or "overlooked", are important in scenarios where the separation between two bodies becomes very small. Including a collision detection algorithm can help classify final states of the simulation (e.g., collision vs. stable orbit vs. escape).
Thus we can narrate how Wolfram Language and related tools can be God's gift to the "world of theoretical insights" in which we form a framework for studying. Some things are better left unstudied, such as the stability as well as chaos in "computationally fixed", gravitationally bound systems.
Randomized Initial Conditions
On the subject of "computationally fixed" and unchanging, collision dynamics with random initialization of positions and velocities is awesome! It provides a more comprehensive view of parameter space. Repeating randomized simulations thousands of times can reveal the statistical likelihood of stable orbits, collisions, or escapes. You can define in Wolfram Language any computation you want, but if you want a short program you sort of have the parameters do things that are sort of human-understandable computation, that is an attempt to understand the extent to which you can or cannot humanize a computation that corresponds to a long mathematical proof; it's sort of a case where you see this case is true step by step by step you get to this result but can you humanize it, expect that you can understand this proof. And say yes, it really is true but we can explain, that I can explain (to) you why this result can't be possible and see on the ground that yes this result is interesting, but there isn't this narrative explanation that has human scale to it.
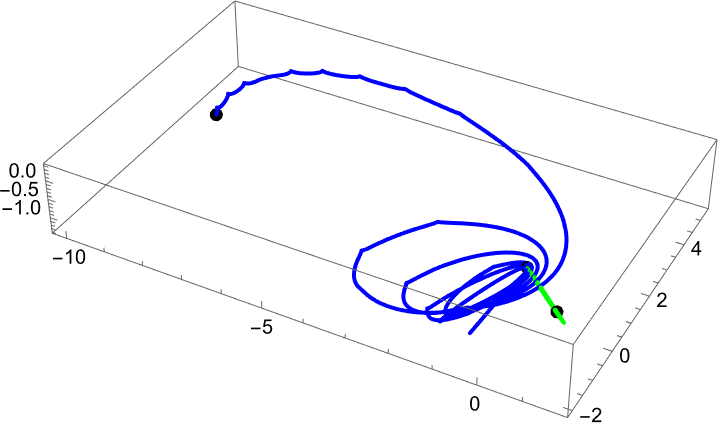
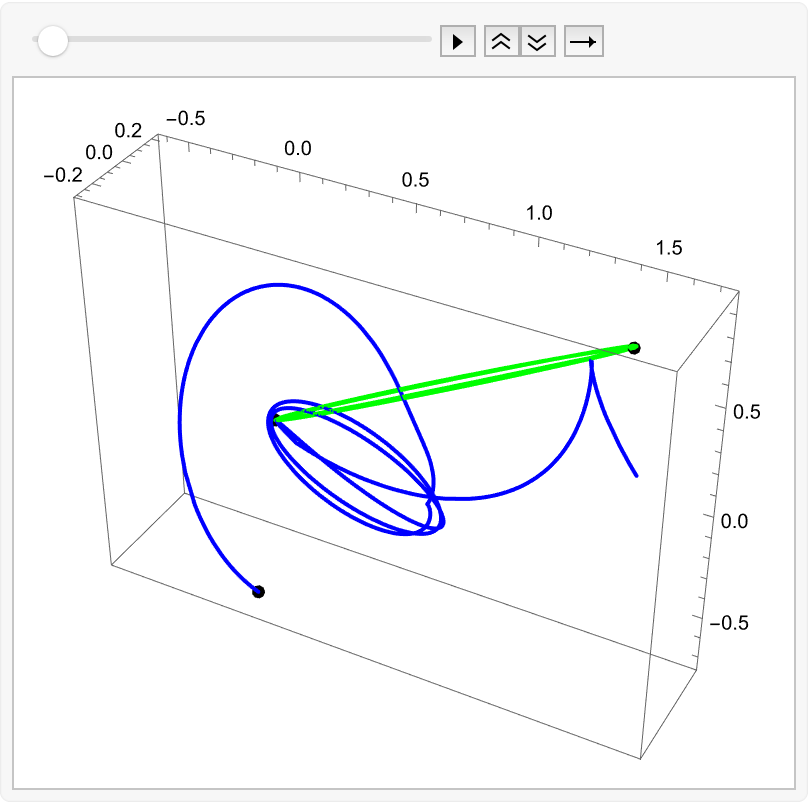
NBodyVisualize[NObj_, m_, inPos_, inVel_, {t1_, t2_}] :=
 Module[{data, dataCentered},
  data = NBodySimulation["InverseSquare",
    Table[<|"Mass" -> m[[i]], "Position" -> inPos[[i]],
      "Velocity" -> inVel[[i]]|>, {i, 1, NObj}], t2];
  dataCentered = (Table[
      data[i, "Position"][#] - data[1, "Position"][#], {i, 1,
       NObj}]) &;
  Show[ParametricPlot3D[{dataCentered[tloc][[1]],
     dataCentered[tloc][[2]], dataCentered[tloc][[3]]}, {tloc, t1,
     t2}, PlotRange -> All, PlotStyle -> {Black, Green, Blue}],
   Graphics3D[{PointSize[0.02], Point[dataCentered[t2]]}]]]
inPosInstance = Table[RandomReal[{-1, 1}, 3], 3]
inVelInstance = Table[RandomReal[{-0.1, 0.1}, 3], 3]
NBodyVisualize[3, {100, 10, 0.1}, inPosInstance, inVelInstance, {0,
  10}]
3. Methods and Implementation
3.1 Code Structure
We will expand on the single-instance-depiction of the original, NBodyVisualize function by introducing collision detection and more general grid-like representations with placeholders for the force law. The core structure remains:
NBodyVisualize[NObj_, m_, inPos_, inVel_, {t1_, t2_}] :=
 Module[{data, dataCentered},
  data = NBodySimulation["InverseSquare",
    Table[<|"Mass" -> m[[i]], "Position" -> inPos[[i]],
      "Velocity" -> inVel[[i]]|>, {i, 1, NObj}], t2];
  dataCentered = (Table[
      data[i, "Position"][#] - data[1, "Position"][#], {i, 1,
       NObj}]) &;
  Show[ParametricPlot3D[{dataCentered[tloc][[1]],
     dataCentered[tloc][[2]], dataCentered[tloc][[3]]}, {tloc, t1,
     t2}, PlotRange -> All, PlotStyle -> {Black, Green, Blue}],
   Graphics3D[{PointSize[0.02], Point[dataCentered[t2]]}]]]
inPosInstance = Table[RandomReal[{-1, 1}, 3], 3]
inVelInstance = Table[RandomReal[{-0.1, 0.1}, 3], 3]
NBodyVisualize[3, {100, 10, 0.1}, inPosInstance, inVelInstance, {0,
  10}]


Are we living in the Matrix? It's an interesting question, it sort of became this idea that somehow we must be living in a simulation because look, with our computers and so on we're able to emulate more and more we're able to have more and more realistic video games and this kind of thing wouldn't it stand to reason we are just part of some future entity video game so to speak? I have to say there's a certain strange resonance with this belief, which was quite popular in the tech industry and theological views, of God made the universe and we get to live in it sort of discussion, about simulation what you would call the human name the "simulator", some kind of "word" aura of God that is the simulator. It's kind of strange that that word God has so much resonance with the kind of versions of God that exist in many kinds of religious tradition and so on and many of the kind of theological arguments, sort of play into this word God that's doing the simulation. One question about God in the universe, that there are different views for example Spinoza always had this nice quote that the universe is the thoughts of god actualized. But there's really a big question about whether the laws of the universe, can they be viable, can they just do what they do and pry what they pry; the oil of those laws of physics that are set in motion, it's just a measure of, there's no choice. There are questions and I think Leibniz asked this question about whether God had a choice in the creation of the universe. The best they care are going to be able to-do are, what are those rules? If I remember the Matrix movie, there were some miracles that happened, there were some things that deviated from the mere rules, the computational rules of the universe that are supposed to run the universe.
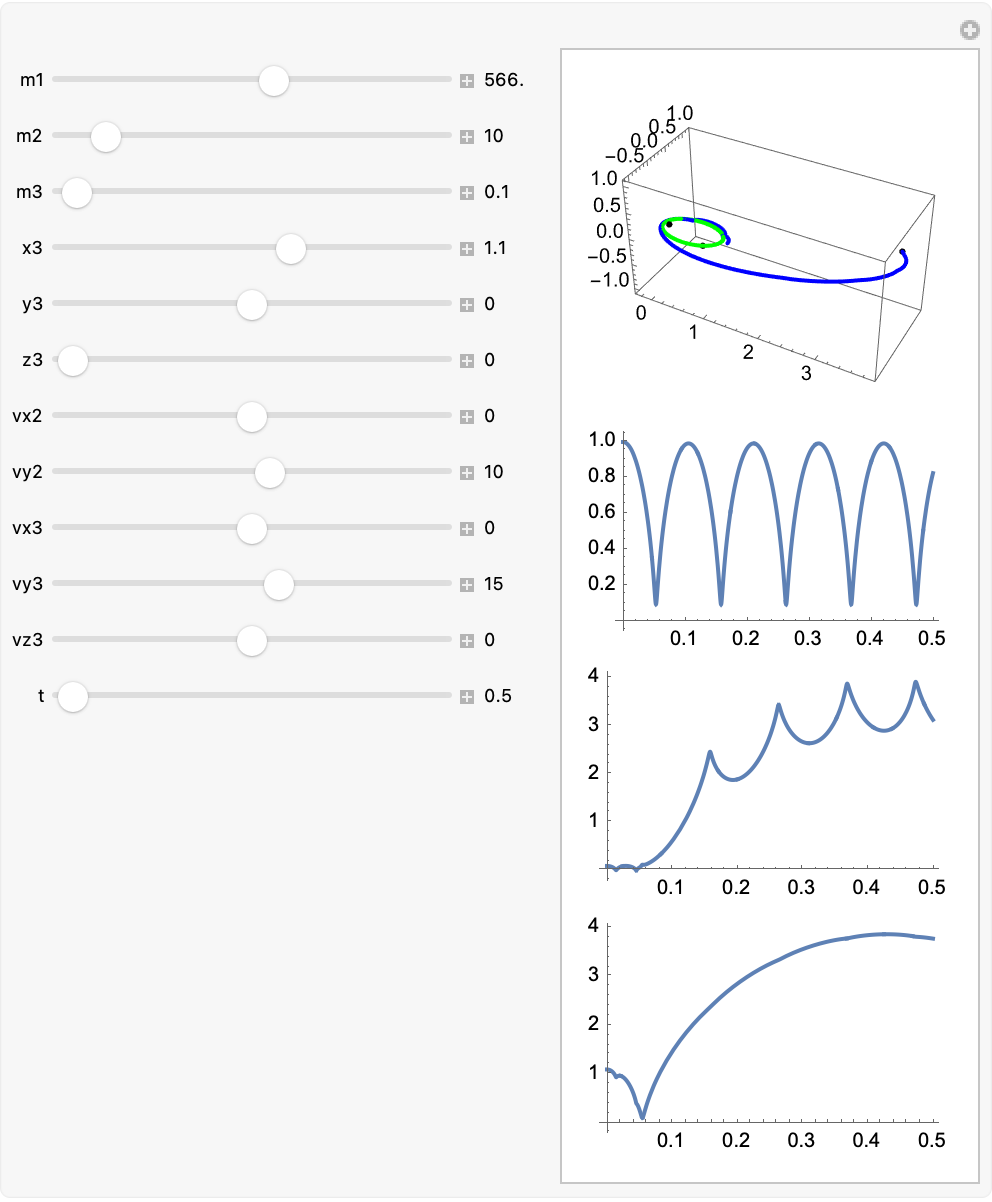
3.2 Collision Detection
Below is a simple demonstration of how collision detection can be introduced nowadays by monitoring pairwise distances. If the distance between any two bodies drops below a specified threshold, we stop the simulation. But first, let's refresh our definition:
NBodyVisualize[NObj_,
  m_,
  inPos_,
  inVel_, {t1_, t2_}
  ] := Module[{data, dataCentered},
  data =
   NBodySimulation[
    "InverseSquare",
    Table[<|"Mass" -> m[[i]], "Position" -> inPos[[i]],
      "Velocity" -> inVel[[i]]|>, {i, 1, NObj}]
    ,
    t2
    ];
  dataCentered =
   (Table[
      data[i, "Position"][#] - data[1, "Position"][#], {i, 1,
       NObj}]) &;
  Column[{Show[
     ParametricPlot3D[
      {dataCentered[tloc][[1]],
       dataCentered[tloc][[2]],
       dataCentered[tloc][[3]]},
      {tloc, t1, t2},
      PlotRange -> All,
      PlotStyle -> {Black, Green, Blue}
      ],
     Graphics3D[{PointSize[0.02], Point[dataCentered[t2]]}]
     ],
    Plot[Norm[Part[dataCentered[t], 2]], {t, t1, t2}],
    Plot[
     Norm[Part[dataCentered[t], 3] - Part[dataCentered[t], 2]], {t,
      t1, t2}],
    Plot[Norm[Part[dataCentered[t], 3]], {t, t1, t2}]}]
  ]

With[{nSnapshots = 12},
 Module[{snapshots},
  snapshots =
   Table[(NBodyVisualize[3, {100, 10, 0.1},
      Table[RandomReal[{-1, 1}, 3], 3],
      Table[RandomReal[{-0.1, 0.1}, 3], 3], {0, 10}]), {nSnapshots}];
  collage = GraphicsGrid[Partition[snapshots, 4], Spacings -> 10];
  collage]]
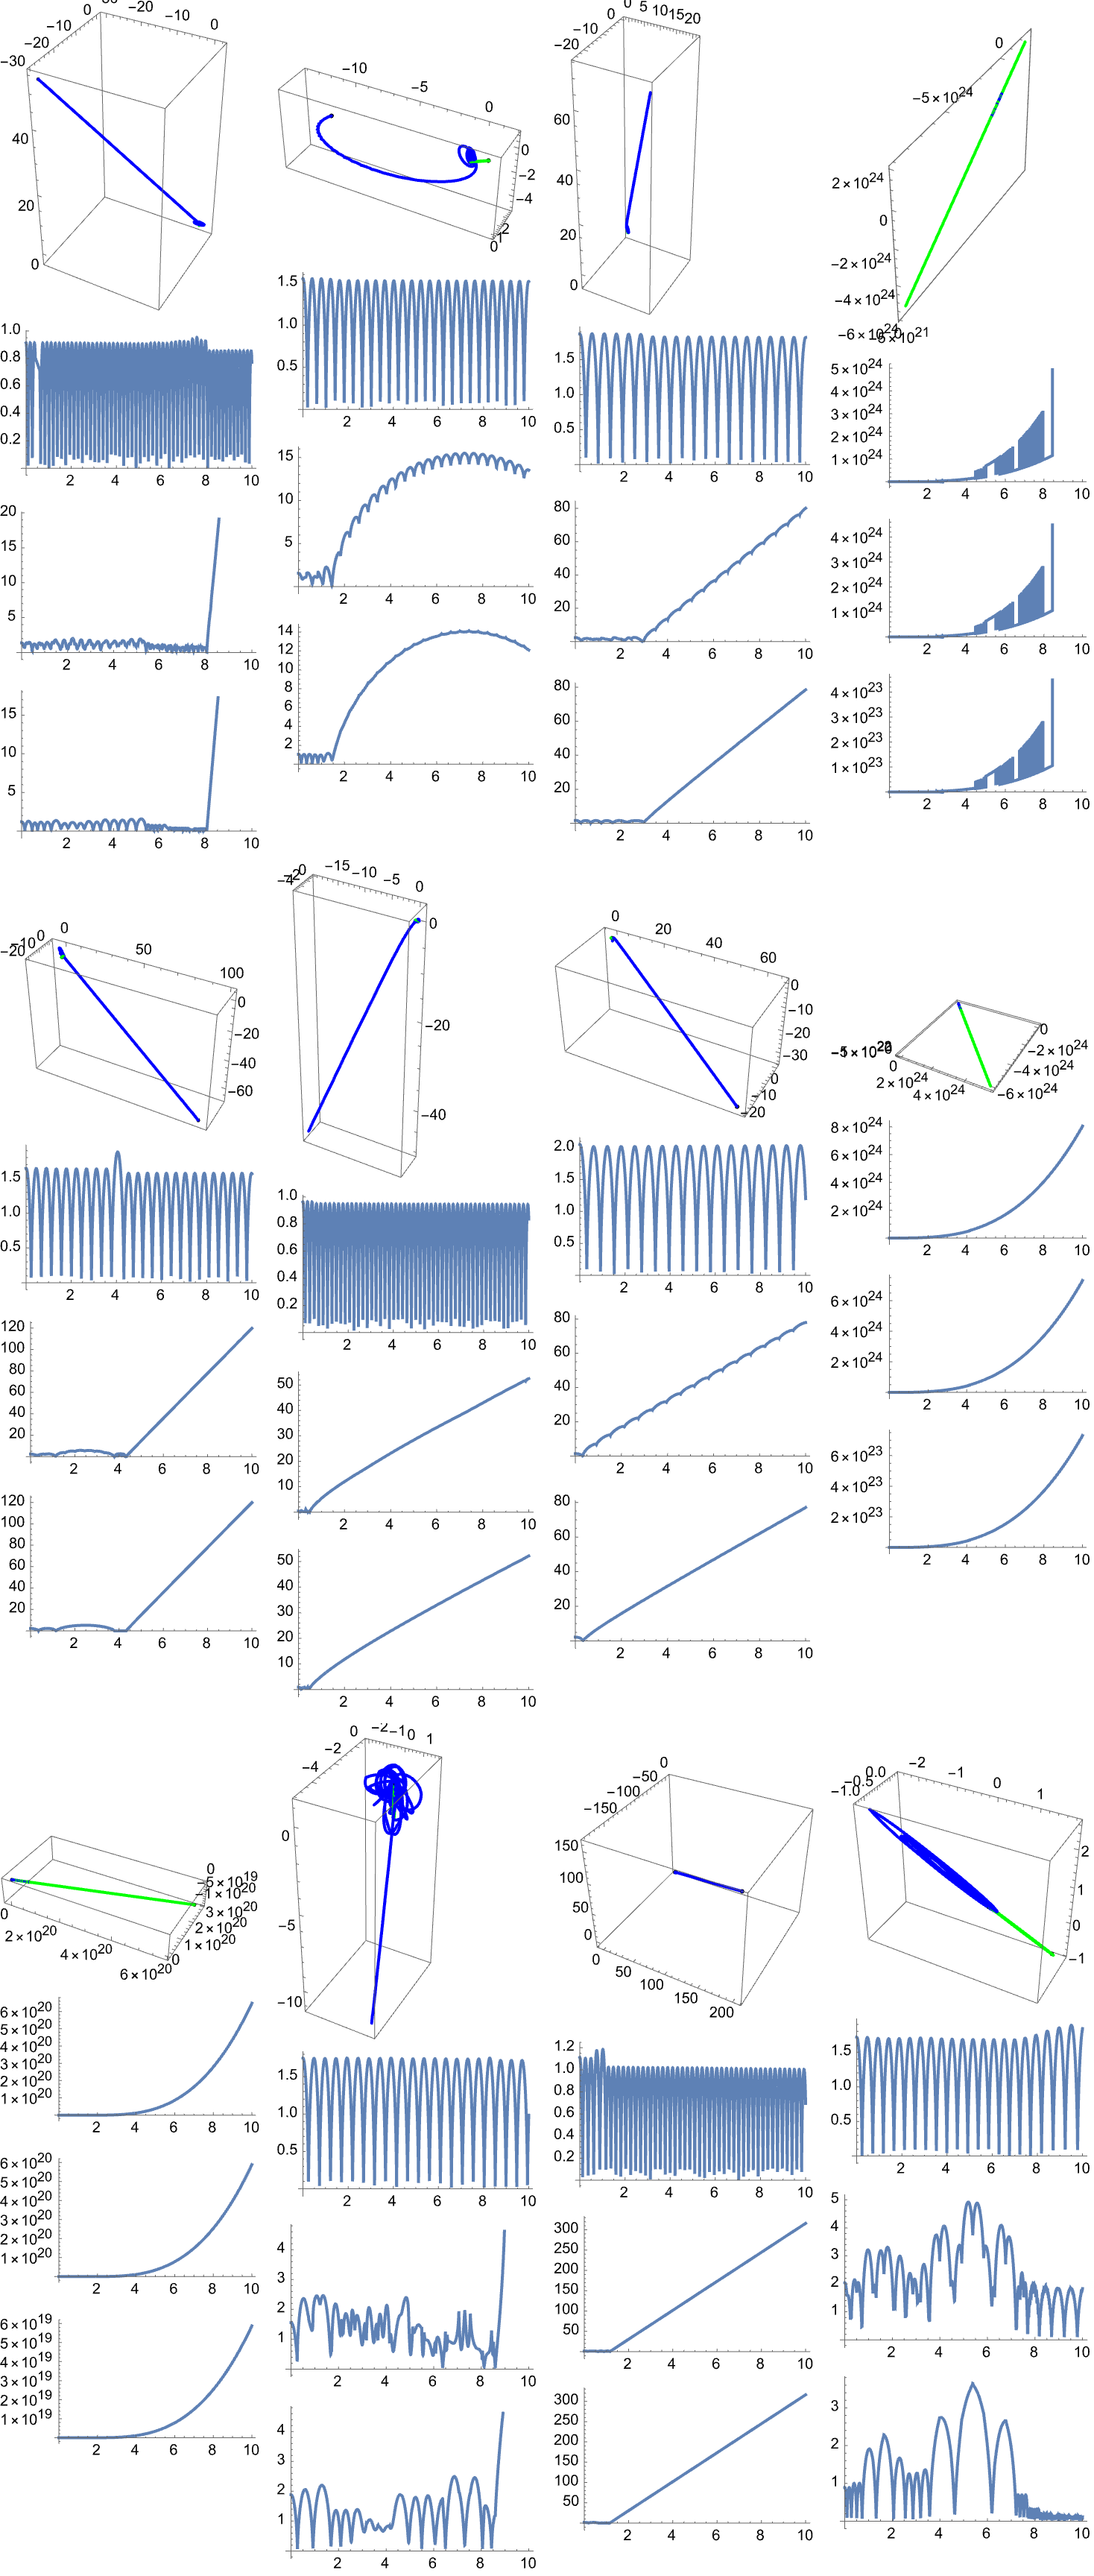
The threshold can be tuned depending on whether the system is meant to model celestial bodies (Where actual collision is unlikely) or smaller scales where collisions are frequent.
3.3 Random Initial Conditions and Statistical Analysis
Generating many initial conditions can reveal patterns that might otherwise go unnoticed. Think of it as the motion of celestial beings, if you were to do an IQ test it would really make you wonder how this randomization of points happens and it happens, near a reference point:
m = {100, 10, 0.1};
inPos = {{0, 0, 0}, {1, 0, 0}, {1.1, 0, 0}};
inVel = {{0, 0, 0}, {0, 10, 0}, {0, 15, 0}};
{t1, t2} = {0.01, 10};
data = NBodySimulation["InverseSquare",
   Table[<|"Mass" -> m[[i]], "Position" -> inPos[[i]],
     "Velocity" -> inVel[[i]]|>, {i, 1, 3}], t2];
dataCentered = Table[data[i, "Position"], {i, 1, 3}];
frames =
  Table[Show[
    Graphics3D[{{PointSize[0.02],
       Point[dataCentered[[#1]][t]] & /@ Range[1, 3]},
      Arrow[{dataCentered[[#1]][t - 0.01], dataCentered[[#1]][t]}] & /@
        Range[1, 3]}, Axes -> True, AxesLabel -> {"X", "Y", "Z"},
     PlotRange -> {{-5, 5}, {-5, 5}, {-5, 5}}, ImageSize -> Large,
     SphericalRegion -> True],
    PlotLabel ->
     Style["Time: " <> ToString[N@t, StandardForm] <> " / " <>
       ToString[N@t2, StandardForm], 15]], {t, t1, t2, 0.1}];
ListAnimate[frames, SaveDefinitions -> True]
Export["NBodySimulation2.gif", frames]
We then iterate over many runs and finalize / formalize the shape of the runs and record the outcomes. People oftentimes forget how "important" it is to have a perspective and alter the camera angle and that's the reason why.
frames =
  Table[Show[
    Graphics3D[{{PointSize[0.02],
       Point[dataCentered[[#1]][t]] & /@ Range[3]},
      Arrow[{dataCentered[[#1]][t - 0.1], dataCentered[[#1]][t]}] & /@
        Range[3]}, Axes -> True, AxesLabel -> {"X", "Y", "Z"},
     PlotRange -> All, ImageSize -> Large, SphericalRegion -> True],
    PlotLabel ->
     Style["Time: " <> ToString[N@t] <> " / " <> ToString[N@t2],
      15]], {t, t1, t2, 0.1}];
ListAnimate[frames, SaveDefinitions -> True]
From record outcomes from there, one can tally the fraction of collisions, escapes, or stable orbits as a function of the chosen parameters. We could explore what effect on the gravitron what "that would be", ..leave that as an exercise to the reader. For now, get in the spaceship, do a look at some telescoping starry type of examples.
4. Numerical Examples
4.1 Eccentric Star-Planet-Moon System
A new set of examples can be used to explore the effect of increased eccentricity in the planet's orbit around the star. Under the hood, one might fix the moon's initial orbit to be circular and then compare how quickly orbits become unstable when the planet's orbit is given a large eccentricity. So let's go ahead and look at a couple of good examples.
4.2 Multiple Planets and Moons
By taking the same approach but setting NObj > 3, it becomes straightforward to add multiple planets--each with its own moon--and see how the system evolves. The main limitation is computation time, so strategies such as adaptive step size or parallelized runs may be required. This is very much also often quoted there is evidence for the existence of God, there can be miracles which sort of deviate from the laws of Physics, the discretionary acts of God independent from the laws of nature that are set in definite form. In our model of Physics there's more information here. Some kind of definable rule, just has to pick the rule and then everything else just runs.
Manipulate[
 NBodyVisualize[
  3, {100, 100,
   100}, {{0, 0, 0}, {3, 0, 0}, {1, 1, 0}}, {{0, 0, 0}, {0, .7,
    0}, {0, .6, 0}}, {0, t}], {t, 1, 10}]
frames =
  Table[NBodyVisualize[
    3, {100, 100,
     100}, {{0, 0, 0}, {3, 0, 0}, {1, 1, 0}}, {{0, 0, 0}, {0, .7,
      0}, {0, .6, 0}}, {0, t}], {t, 1, 10, 0.1}];

Export["NBodyManipulate.gif", frames]
5. Results and Observations
5.1 Emergence of Chaotic Zones
So in terms of the sprints that we do, "up" the steps of computational irreducibility where we find the things that we wanted to do and if we really wanted to do them we could find that as bodies become more numerous and initial conditions are randomized, chaotic zones become more apparent. We could find that the three body problem, the habitable zone problem--these zones are typically characterized by wide scatter in final orbital parameters and frequent collisions.
5.2 Stable Configurations
Even in larger N-Body systems, there are stable configurations. These configurations often have resonances it's like what happens when the UN gets involved, you "bring out the big" symmetrical initial conditions and then a systematic search can discover these "islands of stability' surrounded by chaotic regimes. That's why I feel completely fulfilled by the Ruliad. I see so many directions for future research.
6. Future Work
If there's any computational, potential next steps in this line of research they would include:
- Incorporating other force laws (e.g., "InverseCube" or perturbative factors such as oblateness).
- Examining the impact of dissipative forces like drag in protoplanetary disks.
- Adapting the code for GPU or parallel computing resources to handle larger N. The Ruliad is the set of all possible computations, all possible rules this Ruliad object the point is that we, are sampling a tiny part of that space of possible rules. All of us humans are very close together in that Rulial space so out of the realm of all possible rules I physically cannot think of any other kind of conversation I would like to be having I want the Ruliad.
- I found your analysis helpful in one possible way--developing semi-analytical methods to detect stability boundaries without exhaustive simulations.
Manipulate[
 NBodyVisualize[
  3, {100, 100,
   100}, {{0, 0, 0}, {3, 0, 0}, {1, 1, 0}}, {{0, 0, 0}, {0, .7,
    0}, {0, .6, 0}}, {0, t}], {t, 1, 10}]

frames =
  Table[NBodyVisualize[
    3, {100, 100,
     100}, {{0, 0, 0}, {3, 0, 0}, {1, 1, 0}}, {{0, 0, 0}, {0, .7,
      0}, {0, .6, 0}}, {0, t}], {t, 1, 10, 0.5}];

Export["NBodyManipulate.gif", frames]
Your project is spectacular; the NBodyVisualize Module really shows the semi-major axis within equations in Hamiltonian form! For example, increase the mass and time step, de-structure dataCentered[tloc] or decrease the initial position & velocity.
NBodySimulation[
  "InverseSquare", {<|"Mass" -> 1, "Position" -> {0, 0, 0},
    "Velocity" -> {0, 0, 0}|>,
   <|"Mass" -> 1, "Position" -> {1, 1, 1}, "Velocity" -> {0, 0, 0}|>,
   <|"Mass" -> 1, "Position" -> {1, 1, 0},
    "Velocity" -> {0, 0, 0}|>},
  1
  ]["HamiltonEquations"]
What are some initial positions and velocities? Why not call helper functions until they are invoked? Is it possible to set dimensions like 0.700002 or e.g. -4.48, and "fix" the position to some random value around {0,0,0}?
What do you know about uploading & embedding animations, for example via Liferay or removing warnings without closing the cell group? So we've got that framework, and now the Star-Planet-Moon three-body system!
NBodyVisualize[NObj_,
  m_,
  inPos_,
  inVel_,
  {t1_, t2_}] := Module[{data1, dataCentered1},
  data = NBodySimulation[
    "InverseSquare",
    Table[<|"Mass" -> m[[i]], "Position" -> inPos[[i]],
      "Velocity" -> inVel[[i]]|>, {i, 1, NObj}],
    t2];
  dataCentered = (Table[
      data[i, "Position"][#] - data[1, "Position"][#], {i, 1,
       NObj}]) &;
  Show[ParametricPlot3D[
    {dataCentered[tloc][[1]], dataCentered[tloc][[2]],
     dataCentered[tloc][[3]]},
    {tloc, t1, t2},
    PlotStyle -> {Black, Green, Blue}
    ],
   Graphics3D[{PointSize[0.02], Point[dataCentered[t2]]}]]]

inPosInstance = Table[RandomReal[{-1, 1}, 3], 3]
inVelInstance = Table[RandomReal[{-0.1, 0.1}, 3], 3]

ListAnimate[Table[NBodyVisualize[3,
   {100, 10, 0.1},
   inPosInstance,
   inVelInstance,
   {t, t + 1}],
  {t, 0, .01, .001}], 10]
It sort of looks like a butterfly flap when you provide the number of objects, the scalar mass in a list for the n bodies, the n×n matrices of positions and velocities, as well as the start and end time, and the dimensions of the plot in both directions.
7. Conclusion
This extended discussion highlights how general N-body extensions, collision detection algorithms, randomized initial conditions, and the exploration of mass ratios can deepen our collective understanding of gravitationally interacting systems. So if we all agree on the laws of Physics we can imagine some alien in Rulial space but for us humans we're all close enough that we agree just as, we're all living on one planet and we all pretty much agree what does the night sky look at because we're all looking at the night sky from one point of view so to speak that what's ultimately there, is this Ruliad of all possible computations there's only one of it it's unique, once you have a definition of all the kind of rules and computations and so on you have the Ruliad. The Ruliad is just, is the only possibility so to speak. There's nothing to choose. What there is to choose is where we are in the Ruliad, where in Rulial space we happen to exist. And the very fact that we sort of coherently exist is the fact that we are of a limited size in Rulial space just as we are in a limitized size in physical space. We wouldn't think of ourselves as coexisting as separated entities. This notion that we are localized in Rulial space, that's a sense we're taking our simulator, does it determine the Ruliad the Ruliad necessarily lives that way. By further automating the statistical analysis of outcomes, one can identify complex dynamical behaviors more efficiently. These investigations build on classic three-body insights while offering a more comprehensive view of orbital mechanics in real-world scenarios.


