Update: Do not miss this online event for API
This post is to show how to enhance your python with Mathematica online api with an elaborated example. You may refer to this video for basic ideas before you try the steps below.

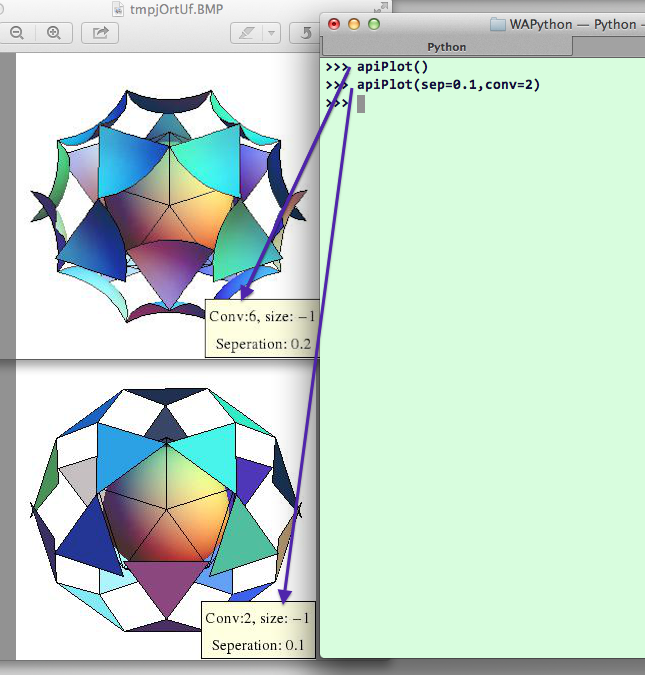
Let's take a look at the product. I have defined one function in python, apiPlot. This function calls a customized API from Mathematica Online deployment and render icosahedron ball. Python opens it locally as the output. You can modify the parameters as well to get several different plots.
You need the following steps to implement the code
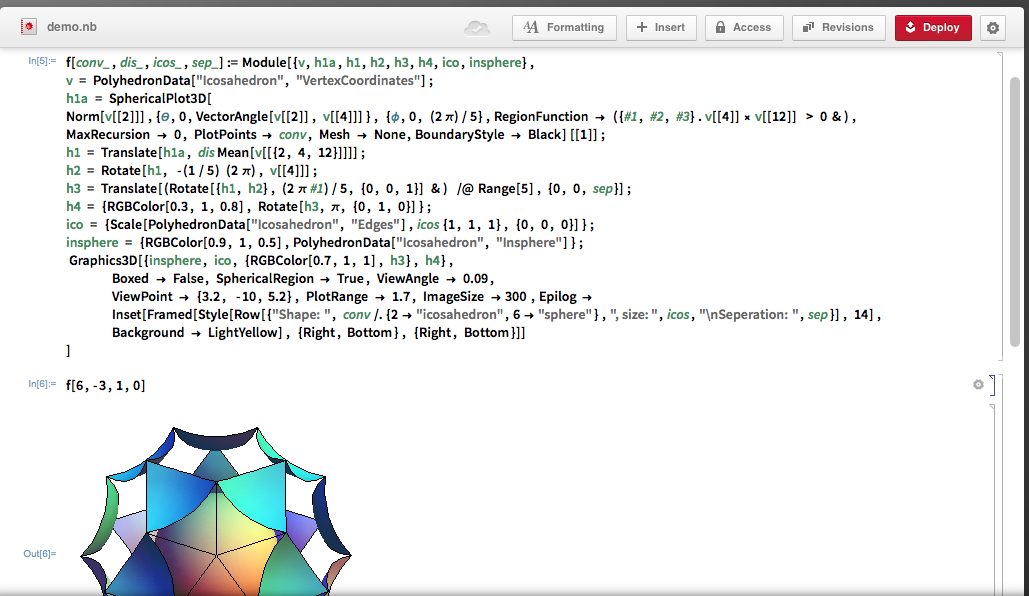
Evaluate the online notebook and make sure it is evaluated correctly
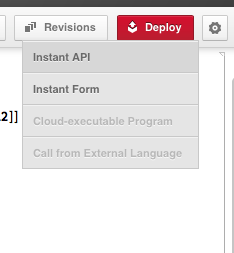
Click the Deploy button on the top-right corner can choose Instant API
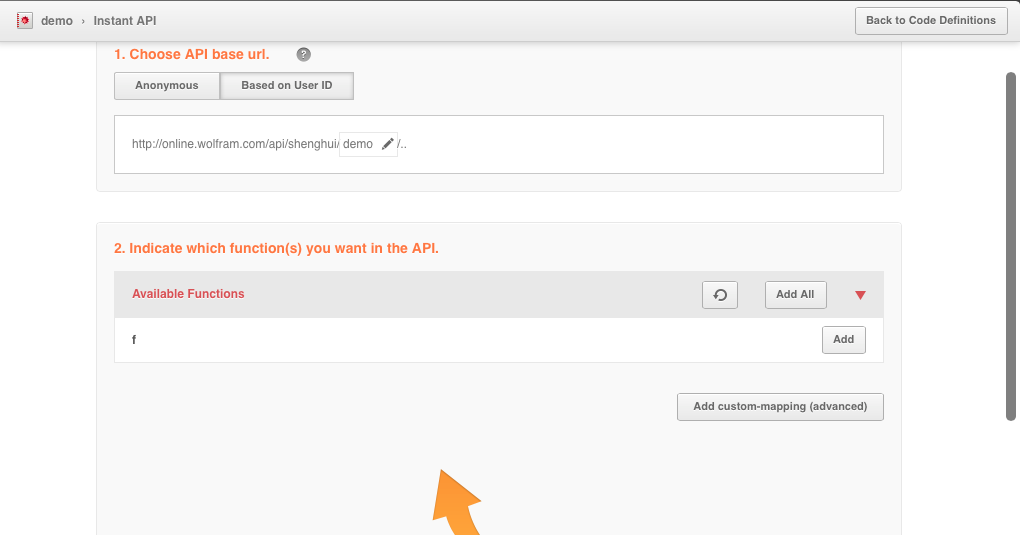
Click Add to pick up the function that you want to call from the API. In my case, just add "f"
Scroll down to expand the "f" and check its argument list (click the circled opener to reveal the details). You can click test api to run the function directly from within the window after you put the values into the function.
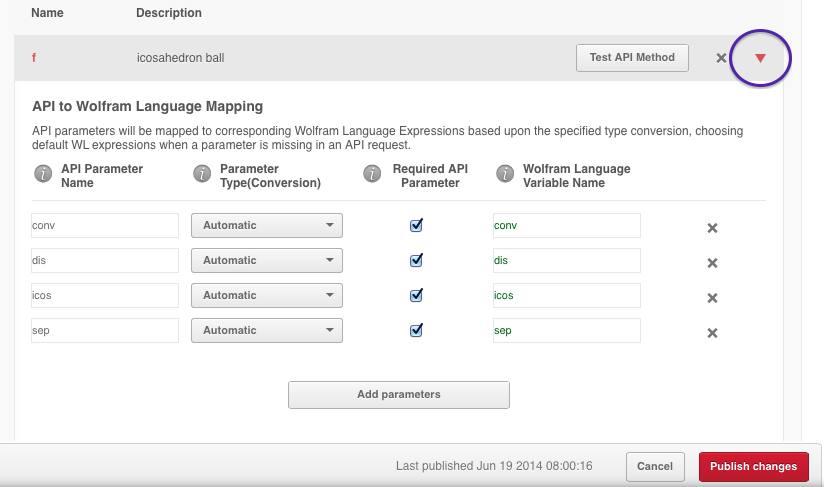
In this case there is only one function involved and the result in the notebooks is correct, you can just go ahead and click the publish.
On the Python side, the implementation is rather simple with default argument support (you will need PIL package for Image):
import urllib
import Image
def apiPlot(conv=6,dis=-3,icos=-1,sep=0.2):
   head= "http://online.wolfram.com/api/shenghui/demo/f?"
   inputList={"conv":conv,"dis":dis,"icos":icos,"sep":sep}
   encodedlist = urllib.urlencode(inputList)
   urllib.urlretrieve(head+encodedlist,"test.jpg")
   img = Image.open("test.jpg")
   img.show()
Once you save it in the myApi.py file and run the code in terminal:
$: python -i myApi.py
 >>> apiPlot()
you can get the same result as my very first screenshot. In fact this piece of code is quite universal, you can change api function/argument names and call most plot/graphics functions via Mathematica online API.
You can refer to more detailed Python+Wolfram Alpha API tutorial from the following link
 Attachments:


