Message Boards Message Boards

0
|
10169 Views
|
5 Replies
|
4 Total Likes
View groups...
Share
Share this post:

FinancialData and daily return values (was:Sorority Simulator)

Posted 10 years ago

I'm just a freshman and my sorority sisters and I need your help.

Not really, but please help me. I'm trying to get the daily return values for the Vanguard fund VO for the last ten years, and I got it:

FinancialData["VO", "Return", "Jun. 26, 2004"]

The problem is that I am trying get a data set of just the daily returns (not the dates), and I am having the darndest time. This is what I'm trying to do:

"Use the past 10 years of daily total returns from the VO fund to create a distribution. Randomly draw 252 returns from that distribution and multiply them together to get an annual return. Do this over and over to create a distribution of annual returns to expect from VO."

I am brand new to Mathematica, any help is very much appreciated, for more info on the project:

http://seekingalpha.com/article/2287813-the-best-passive-retirement-strategy-in-the-world

http://seekingalpha.com/instablog/1117866-joe-springer/3023693-mathematica-what-is-the-area-for-circle-of-competence

Thank you!

Joe

POSTED BY: Joe Springer
5 Replies
Posted 10 years ago

This is unbelievably helpful, thank you both so much!

POSTED BY: Joe Springer

Dear Joe, please do also note that the "returns" that you download:

datatimes = FinancialData["VO", "Return", "Jun. 26, 2004"];

are different from what Jason Cawley generates by his command

VO = FinancialData["VO", {2004,6,26}]; VOret = Drop[VO[[All,2]],1]/Drop[VO[[All,2]],-1];

They differ. I suppose that this is because the FinancialData function in fact returns the logarithmic return. If we plot the logarithm of Jason's time series vs the time series from FinancialData they coincide.

ListLinePlot[{Log[VOret[[1 ;; 100]]], data[[1 ;; 100]]}] 

enter image description here

That would also explain why he gets, more or less, a log-normal distribution whereas I get, more or less, a normal distribution. The idea behind the log normal distribution is after all that if you take the logarithm of the values they are Gaussian distributed. And that is what you see if you compare the two answers. For the definitions you might want to have a look at this wiki page.

It also explains why Jason has to multiply (which is what you, Joe, suggested in your first post) and I had to add the numbers. I am not quite sure whether in the mathematica help system for FinancialData this is made suffienently clear:

"Return" daily return on a particular day, allowing dividends

I believe that what is given is actually the logarithmic return - I might be wrong though. Jason, do you agree?

Also the histogram of the original data we get from the FinancialData function is most definitely not Gaussian distributed. It peaks more and might be closer to a TsallisQGaussianDistribution - see the PS below. Only after the summation the distribution becomes "more normal", so much so that the test does not reject the Null; see also the central limit theorem. Furthermore, if the log returns are not actually normally distributed, but say Tsallis/Gaussian, I would think that Jason's data is also not log-normally distributed.

Cheers, Marco

PS: You might also want to have a look at this website.

POSTED BY: Marco Thiel

Here is how I do it -

VO = FinancialData["VO", {2004,6,26}];

But you can also use the "Value" option of the FinancialData function to drop the dates. If you only want the daily returns, you can ask for the "FractionalChange" property - the default is the AdjustedClose property which is what was retrieved above. But let's get the daily returns ourselves so we know where they came from.

VOret = Drop[VO[[All,2]],1]/Drop[VO[[All,2]],-1];

[[All,2]] just says give me part 2 of each item in the VO expression. The Drop commands just leave out the first or last item of the list, using the 1 to drop the first, and -1 to drop from the end. The division of 2 lists of the same length divides them term-by-term, because it is Listable. The offset means that we are getting the second term divided by the first, then the third divided by the second, etc. That gives us the "geometric first difference" 1.02x, 0.99x, etc. Subtracting 1 from each term gives us just the fractional change.

Let's visualize it to see that we got it right -

Histogram[VOret, {.005}, "Probability"]

Note that the second argument tells the histogram to use bin-widths of half of one percent for these daily changes. The "Probability" third argument tells the histogram to report a portion of the data in each bin, rather than an absolute count.

When you plot it, notice that it is sharply peaked and not really a bell. We can verify that by asking for

Kurtosis[VOret]

It comes back as 11.34, where a Gaussian bell has a Kurtosis of 3. So there is much less "weight" in the midrange flanks and much more right around the zero midpoint, and out on the long tails, than in a Gaussian distribution. A lognormal wouldn't actually capture those features (it would force a Kurtosis of 3), and that is a reason to use a bootstrap approach instead of a fitted LogNormalDistribution.

Let's now directly make a synthetic distribution fitted to our data -

retD = SmoothKernelDistribution[VOret];

Simple as that, retD is now a distribution object that we can use to simulate random walks with the daily return matching VO. Let's make some samples, each 252 steps long because that is the number of trading days in a year, and let's make 1000 of them.

sample = RandomVariate[retD, {1000,252}];

Those are full paths and we could look at them all. But what we really care about is the yearly return, which results from all those daily returns - we have 1000 of those.

yearreturns = (Fold[#1 * #2&, 1, #]-1)&/@sample;

The function Fold "eats" one element of its third-argument list at each step, and applies its first-argument function to its previous result - #1 - with the new element from the list fed in as its second argument - #2. So we read that as, at each step take your own number and multiply it by the new return. The second argument to Fold says start this process at the value 1. The rest of the line is just asking for this to be done to every line of our sample - all 1000 of them. (We subtract off the starting 1 to get the return as a change in value for the year).

By the way, if you want to keep the whole history instead of just the endpoint of each year, then you would just want FoldList instead of Fold. FoldList leaves behind a history of each step in applied, instead of just the last result.

Let's visualize those annual returns from our simulated VO -

Histogram[yearreturns, {.05}, "Probability"]

We can also ask for things like the Mean and StandardDeviation of those annual returns -

Mean[yearreturns]

12.34% is what we get for my sample - a different group of 1000 runs might be somewhat different.

StandardDeviation[yearreturns]

Technically we probably want to get the standard deviation slightly differently, since we expect these to be approximately lognormal not normally distributed -

{E^-StandardDeviation[Log[1+yearreturns]], E^StandardDeviation[Log[1+yearreturns]]}

That helps make clear that we would expect anything between -20% and +26% in any given year around the expected return. Let's also just calculate what that means a -1 SD year return looks like, a mean = 0 SD year, and a +1 SD year -

Mean[yearreturns+1]* {E^-StandardDeviation[Log[1+yearreturns]], 1, E^StandardDeviation[Log[1+yearreturns]]}

That tells us that a "typical" 1SD down year will see an 11% decline, a normal expected year +12,3%, and a good +1SD year a 41.5% gain.

We can keep going, of course...

Sincerely,

Jason Cawley Phoenix, AZ

POSTED BY: Jason Cawley
Posted 10 years ago

Thank you so much Marco!!

POSTED BY: Joe Springer

Dear Joe,

here are some ideas:

1) this is what you download:

datatimes = FinancialData["VO", "Return", "Jun. 26, 2004"];

as you say it contains the dates.

2) you only take the magnitudes for each day.

data = datatimes[[All, 2]];

3) you can calculate a smooth kernel distribution

Plot[PDF[SmoothKernelDistribution[data], x], {x, -0.1, 0.1}, PlotRange -> All]
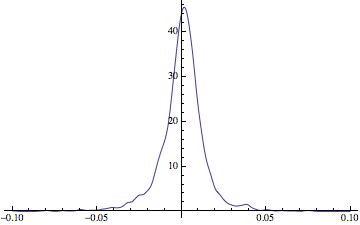
enter image description here

4) this generates the product of a random choice of 252 returns:

Product[RandomChoice[data, 252][[i]], {i, 1, 252}]

It does not help a lot because it is numerically nearly always zero - on the bright side it is probably not what you want to calculate anyway. The mean of the returns is

Mean[data]

which evaluates to 0.000551085. The standard deviation is

StandardDeviation[data]

which is 0.0144021. The product of many numbers that come from such a narrow distribution around zero can become very small. Also

Min[Abs[data]]

is 0. Actually,

Sort[Abs[data]]

gives:

{0., 0., 0., 0., 0., 0., 0., 0., 0., 0., 0., 0., 0., 0., 0., 0., 0., 1.1102210^-16, 1.1102210^-16, 0.00010582, 0.000108319, 0.00011383, 0.000118779, 0.000120048, 0.000123977, 0.000124425, 0.000124,....}

If any of the first numbers are in your random choice you get zero.

5) Luckily, to get an average return you might not want to multiply the data but rather sum them up

Sum[RandomChoice[data, 252][[i]], {i, 1, 252}]

6) The histogram of that is:

Histogram[Table[Sum[RandomChoice[data, 252][[i]], {i, 1, 252}], {k, 1, 500}], 20]
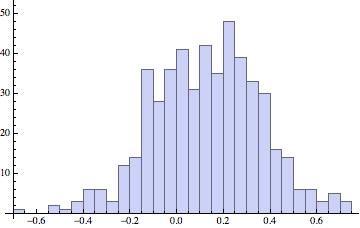
enter image description here

7) The mean over 500 of these realisations can be obtained like so:

Mean[Table[Sum[RandomChoice[data, 252][[i]], {i, 1, 252}], {k, 1, 500}]]

I got 0.149755 when I ran it for my realisation. This seems to be more or less ok, because the average daily return was 0.000551085. Multiplying this by 252 gives 0.138873.

8) Let's see. If we run the entire thing say 100 times

Monitor[Table[Mean[Table[Sum[RandomChoice[data, 252][[i]], {i, 1, 252}], {k, 1, 500}]], {j,1, 100}], j]

we get

{0.130739, 0.1443, 0.12358, 0.127578, 0.123799, 0.127366, 0.137378, \
0.142802, 0.123663, 0.131705, 0.143079, 0.129468, 0.133854, 0.152172, \
0.14965, 0.124151, 0.148038, 0.129823, 0.124735, 0.142115, 0.13393, \
0.146552, 0.142295, 0.145668, 0.148012, 0.149947, 0.157339, 0.144625, \
0.131332, 0.152722, 0.152528, 0.132397, 0.149237, 0.133508, 0.147617, \
0.133868, 0.1329, 0.155013, 0.144509, 0.139821, 0.1457, 0.160008, \
0.140802, 0.122112, 0.139138, 0.147673, 0.136278, 0.142777, 0.117216, \
0.113688, 0.142883, 0.132171, 0.140114, 0.146726, 0.142973, 0.15172, \
0.136722, 0.141169, 0.128717, 0.1394, 0.138362, 0.145236, 0.151213, \
0.13936, 0.123638, 0.12851, 0.140283, 0.139783, 0.12457, 0.137845, \
0.13261, 0.153618, 0.126994, 0.127699, 0.137892, 0.15243, 0.151824, \
0.131615, 0.135664, 0.134355, 0.144779, 0.126877, 0.135637, 0.129136, \
0.144117, 0.139079, 0.144863, 0.13009, 0.142233, 0.127004, 0.118718, \
0.154026, 0.137453, 0.111452, 0.148349, 0.137895, 0.140912, 0.116243, \
0.134876, 0.129615}

The mean of that

Mean[%]

is 0.137787. And the variance is

Variance[%%]

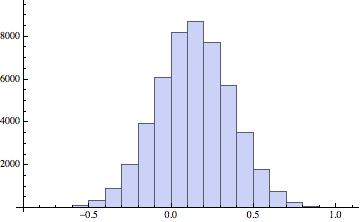
0.000106633 and the standard deviation is 0.0103263. So after altogether 500*100=50000 realisations we are quite close to the theoretical value of 0.138873. We now can calculate the histogram from point 6 for 50k realisations:

Monitor[Histogram[Table[Sum[RandomChoice[data, 252][[i]], {i, 1, 252}], {k, 1, 50000}], 20], k]

This gives the really smooth histogram
enter image description here

8) I suppose that to a very good approximation that is Gaussian distributed. Let's check that.

DistributionFitTest[datalist, Automatic, "TestConclusion", SignificanceLevel -> 0.05]

Results:

The null hypothesis that the data is distributed according to the NormalDistribution[[FormalX],[FormalY]] is not rejected at the 5. percent level based on the Cramér-von Mises test.

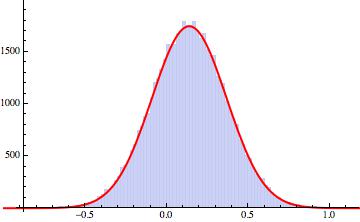
If we fit a Gaussian and then plot them together we get:

Show[Histogram[datalist], Plot[1000*PDF[EstimatedDistribution[datalist, NormalDistribution[\[Mu], \[Sigma]]], x], {x, -1, 1.2}, PlotStyle -> {Red, Thick}]]

This give this nice figure:
enter image description here

With this it becomes easy to make all sorts of nice predictions. Oh, yes, here are the parameters I got for the distribution:

EstimatedDistribution[datalist, NormalDistribution[\[Mu], \[Sigma]]]

gives: NormalDistribution[0.137692, 0.22852].

I hope that helps a bit. It is quite safe to ignore point 8. That one is just for fun.

Cheers, Marco

POSTED BY: Marco Thiel
Reply to this discussion
Community posts can be styled and formatted using the Markdown syntax.
Reply Preview
Attachments
Remove
or Discard

Group Abstract Group Abstract