Message Boards Message Boards

0
|
4252 Views
|
4 Replies
|
0 Total Likes
View groups...
Share
Share this post:

plotting problem - empty graph

f[x_] = ((x - 50000)^4.51846) (E^(50000 - x)) (4.6924*^-7) - this is my function. Plot[{f[x]}, {x, 0, 50000}] command gives me no GRAPH!!! What should i conclude? When i want to see the data points using "data = (InputForm@p)[[1, 1, 1, 3, 2, 1]]". I am not able to interpret the result!! something like this comes up...

Graphics[GraphicsComplex[list of points......] Can anybody throw some light on this?

4 Replies

I do not know why it returned GraphicsComplex instead of Line here. btw, you need to use := not = in the function definition. When asking questions, it helps to post complete self contained code you used all in one cell. This helps someone see what you actually typed. Include all definitions and commands used.

POSTED BY: Nasser M. Abbasi

This was the code i used for plotting f[x] versus x. f[x_] := ((x - 50000)^4.51846) (E^(50000 - x)) (4.6924*^-7) After typing this, when i entered f[x] the result was 4.6924*10^-7 E^(50000 - x) (-50000 + x)^4.51846 It means the function definition is correct. After this when i wanted to plot f versus x, i used the following command

p= Plot[f, {x, 0, 50000}] I did not get any graph!!! i wanted to know the points. For that i used "data = (InputForm@p)[[1, 1, 1, 3, 2, 1]]". After this the result was, Graphics[GraphicsComplex[{{0.00010204081632653062, 0.}, {98.143306007652, 0.}, {204.54178542729326, 0.},etc... Now Can anyone explain what i should do? I am not able to understand this..

Hi,

there are several "issues" here. First of all

(x - 50000)^4.51846

is complex for x<50000, e.g.

(x - 50000)^4.51846 /. x -> 2
is -9.88935*10^19 + 1.70333*10^21 I.

Plot does not plot complex numbers.The "interesting part of your graph is for x>50000.

Also, you should plot f[x] instead of "f".

f[x_] := ((x - 50000)^4.51846) (E^(50000 - x)) (4.6924^-7)
Plot[f[x], {x, 50000, 50050}, PlotRange -> All]

does work and gives a reasonable output:

enter image description here

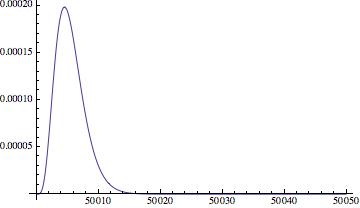
So, if you plot it for x< 50000 it will not produce a useful output, because the Plot function is not made to plot complex functions.

Furthermore, the values that you want to plot are insanely large. Look at this:

Table[Evaluate[f[x]], {x, 0, 5}]

{-1.046106944790515*10^21730 + 
  1.801802763355185*10^21731 I, -3.848064616838928*10^21729 + 
  6.627862949115713*10^21730 I, -1.415495933981097*10^21729 + 
  2.438034178117325*10^21730 I, -5.206847948258534*10^21728 + 
  8.968215982373779*10^21729 I, -1.915319207666480*10^21728 + 
  3.298924128423410*10^21729 I, -7.045428821964528*10^21727 + 
  1.213496687279907*10^21729 I}

In the interesting regime 50000<x<50050 the values are very small. It will be difficult to have a reasonable representation over the entire domain.

Cheers, Marco

POSTED BY: Marco Thiel

Same issue as http://community.wolfram.com/groups/-/m/t/284702

Be aware that clever things like

data = (InputForm@p)[[1, 1, 1, 3, 2, 1]]

are not guaranteed to be the same in different versions.

POSTED BY: Bruce Miller
Reply to this discussion
Community posts can be styled and formatted using the Markdown syntax.
Reply Preview
Attachments
Remove
or Discard

Group Abstract Group Abstract