Plotting these functions is really awkward. They go to extremely large/small numbers and change dramatically if you change the parameters. The easiest way to play with the parameters is to use Manipulate:
ClearAll["Global`*"]

f[w_, x_, y_, z_] := w ((x - 50000)/y)^(z - 1) (E^((50000 - x)/y))/(y Gamma[z]);

Manipulate[Plot[f[w, x, y, z], {x, 50000, 50050}], {{w, -0.65}, -1, 1}, {{y, 0.865}, -1, 1}, {{z, -0.01}, -0.01, 0.01}]
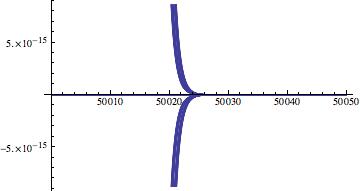
You can ow change the parameters in some (narrow) regions. The function is very sensitive and it is difficult to plot everything reasonably into one figure. This here does work, but is not very helpful:
Table[Plot[f[w, x, y, z], {x, 50000, 50050}], {w, -0.7, -0.6, 0.025}, {y, 0.86, 0.87, 0.002}, {z, -0.01, 0.01, 0.005}] // Show
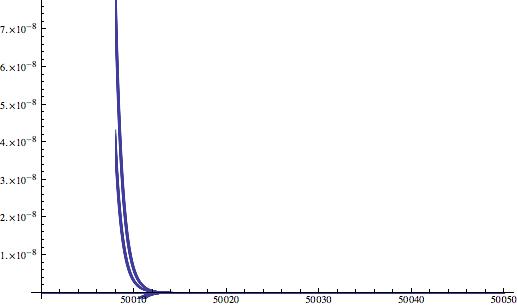
Alternatively, this works
Plot[Table[Evaluate[f[w, x, y, z]], {w, -0.7, -0.6, 0.025}, {y, 0.86, 0.87, 0.002}, {z, -0.01, 0.01, 0.005}], {x, 50000, 50050}]
Cheers,
Marco


