Message Boards Message Boards

0
|
43171 Views
|
4 Replies
|
3 Total Likes
View groups...
Share
Share this post:

how to define multivariable functions and get plots along one argument

f[w,x,y,z]:= w((x-50000)/y)^(z-1)(E^((50000-x)/y))/(yGamma[z])

  • this is my function. I want to plot this function versus x for different values of w,y,z. How do i achieve this in mathematica? i want all the plots in one graph... Can anyone help me out?
4 Replies

fyi, a function in Mathematica is defined using _ as in f[w_,x_,y_,z_]:=. btw, your functions always seem to generate very large values: N@f[1, 1, 1, 1] gives 1.9489499245*10^21714 which is really a large number. Is there a way you can normalize your function first?

POSTED BY: Nasser M. Abbasi

I meant, i want to plot f versus x for different values of w,y,z. I just wanted to make my job simple. For example, i have f[x]= a(b-100)/c x. This is a function of x but for different values of a b and c i want to plot it...i think my question was not clear in the beginning...Now can anyone help me??

Plotting these functions is really awkward. They go to extremely large/small numbers and change dramatically if you change the parameters. The easiest way to play with the parameters is to use Manipulate:

ClearAll["Global`*"]

f[w_, x_, y_, z_] := w ((x - 50000)/y)^(z - 1) (E^((50000 - x)/y))/(y Gamma[z]);

Manipulate[Plot[f[w, x, y, z], {x, 50000, 50050}], {{w, -0.65}, -1, 1}, {{y, 0.865}, -1, 1}, {{z, -0.01}, -0.01, 0.01}]

You can ow change the parameters in some (narrow) regions. The function is very sensitive and it is difficult to plot everything reasonably into one figure. This here does work, but is not very helpful:

Table[Plot[f[w, x, y, z], {x, 50000, 50050}], {w, -0.7, -0.6, 0.025}, {y, 0.86, 0.87, 0.002}, {z, -0.01, 0.01, 0.005}] // Show
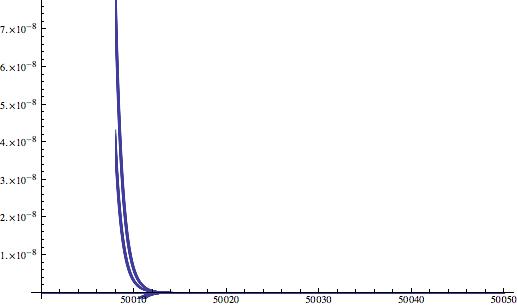
enter image description here

Alternatively, this works

Plot[Table[Evaluate[f[w, x, y, z]], {w, -0.7, -0.6, 0.025}, {y, 0.86, 0.87, 0.002}, {z, -0.01, 0.01, 0.005}], {x, 50000, 50050}]
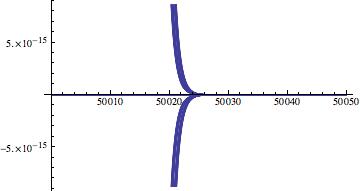
enter image description here

Cheers, Marco

POSTED BY: Marco Thiel

Hi,

in how many dimensions do you want to plot that function? It appears that you have 4 independent variables and one dependent variable. Do you want to plot that in four dimensions and then colour-code the value? Even if you were to plot in the three available spatial dimensions, colour code the value of f and then use "time", i.e. make a video, for the remaining variable it would be very difficult to plot.

Can you show a figure of a function of four independent variables that shows how you want it to be plotted? There are tricks of visualising that, but it would be good to understand your ideas of how you want this to be represented.

M.

POSTED BY: Marco Thiel
Reply to this discussion
Community posts can be styled and formatted using the Markdown syntax.
Reply Preview
Attachments
Remove
or Discard

Group Abstract Group Abstract