Wolfram Language JavaScript Frontend:
DOCUMENTATION: https://jerryi.github.io/wljs-docs/
GITHUB: https://github.com/JerryI/wolfram-js-frontend
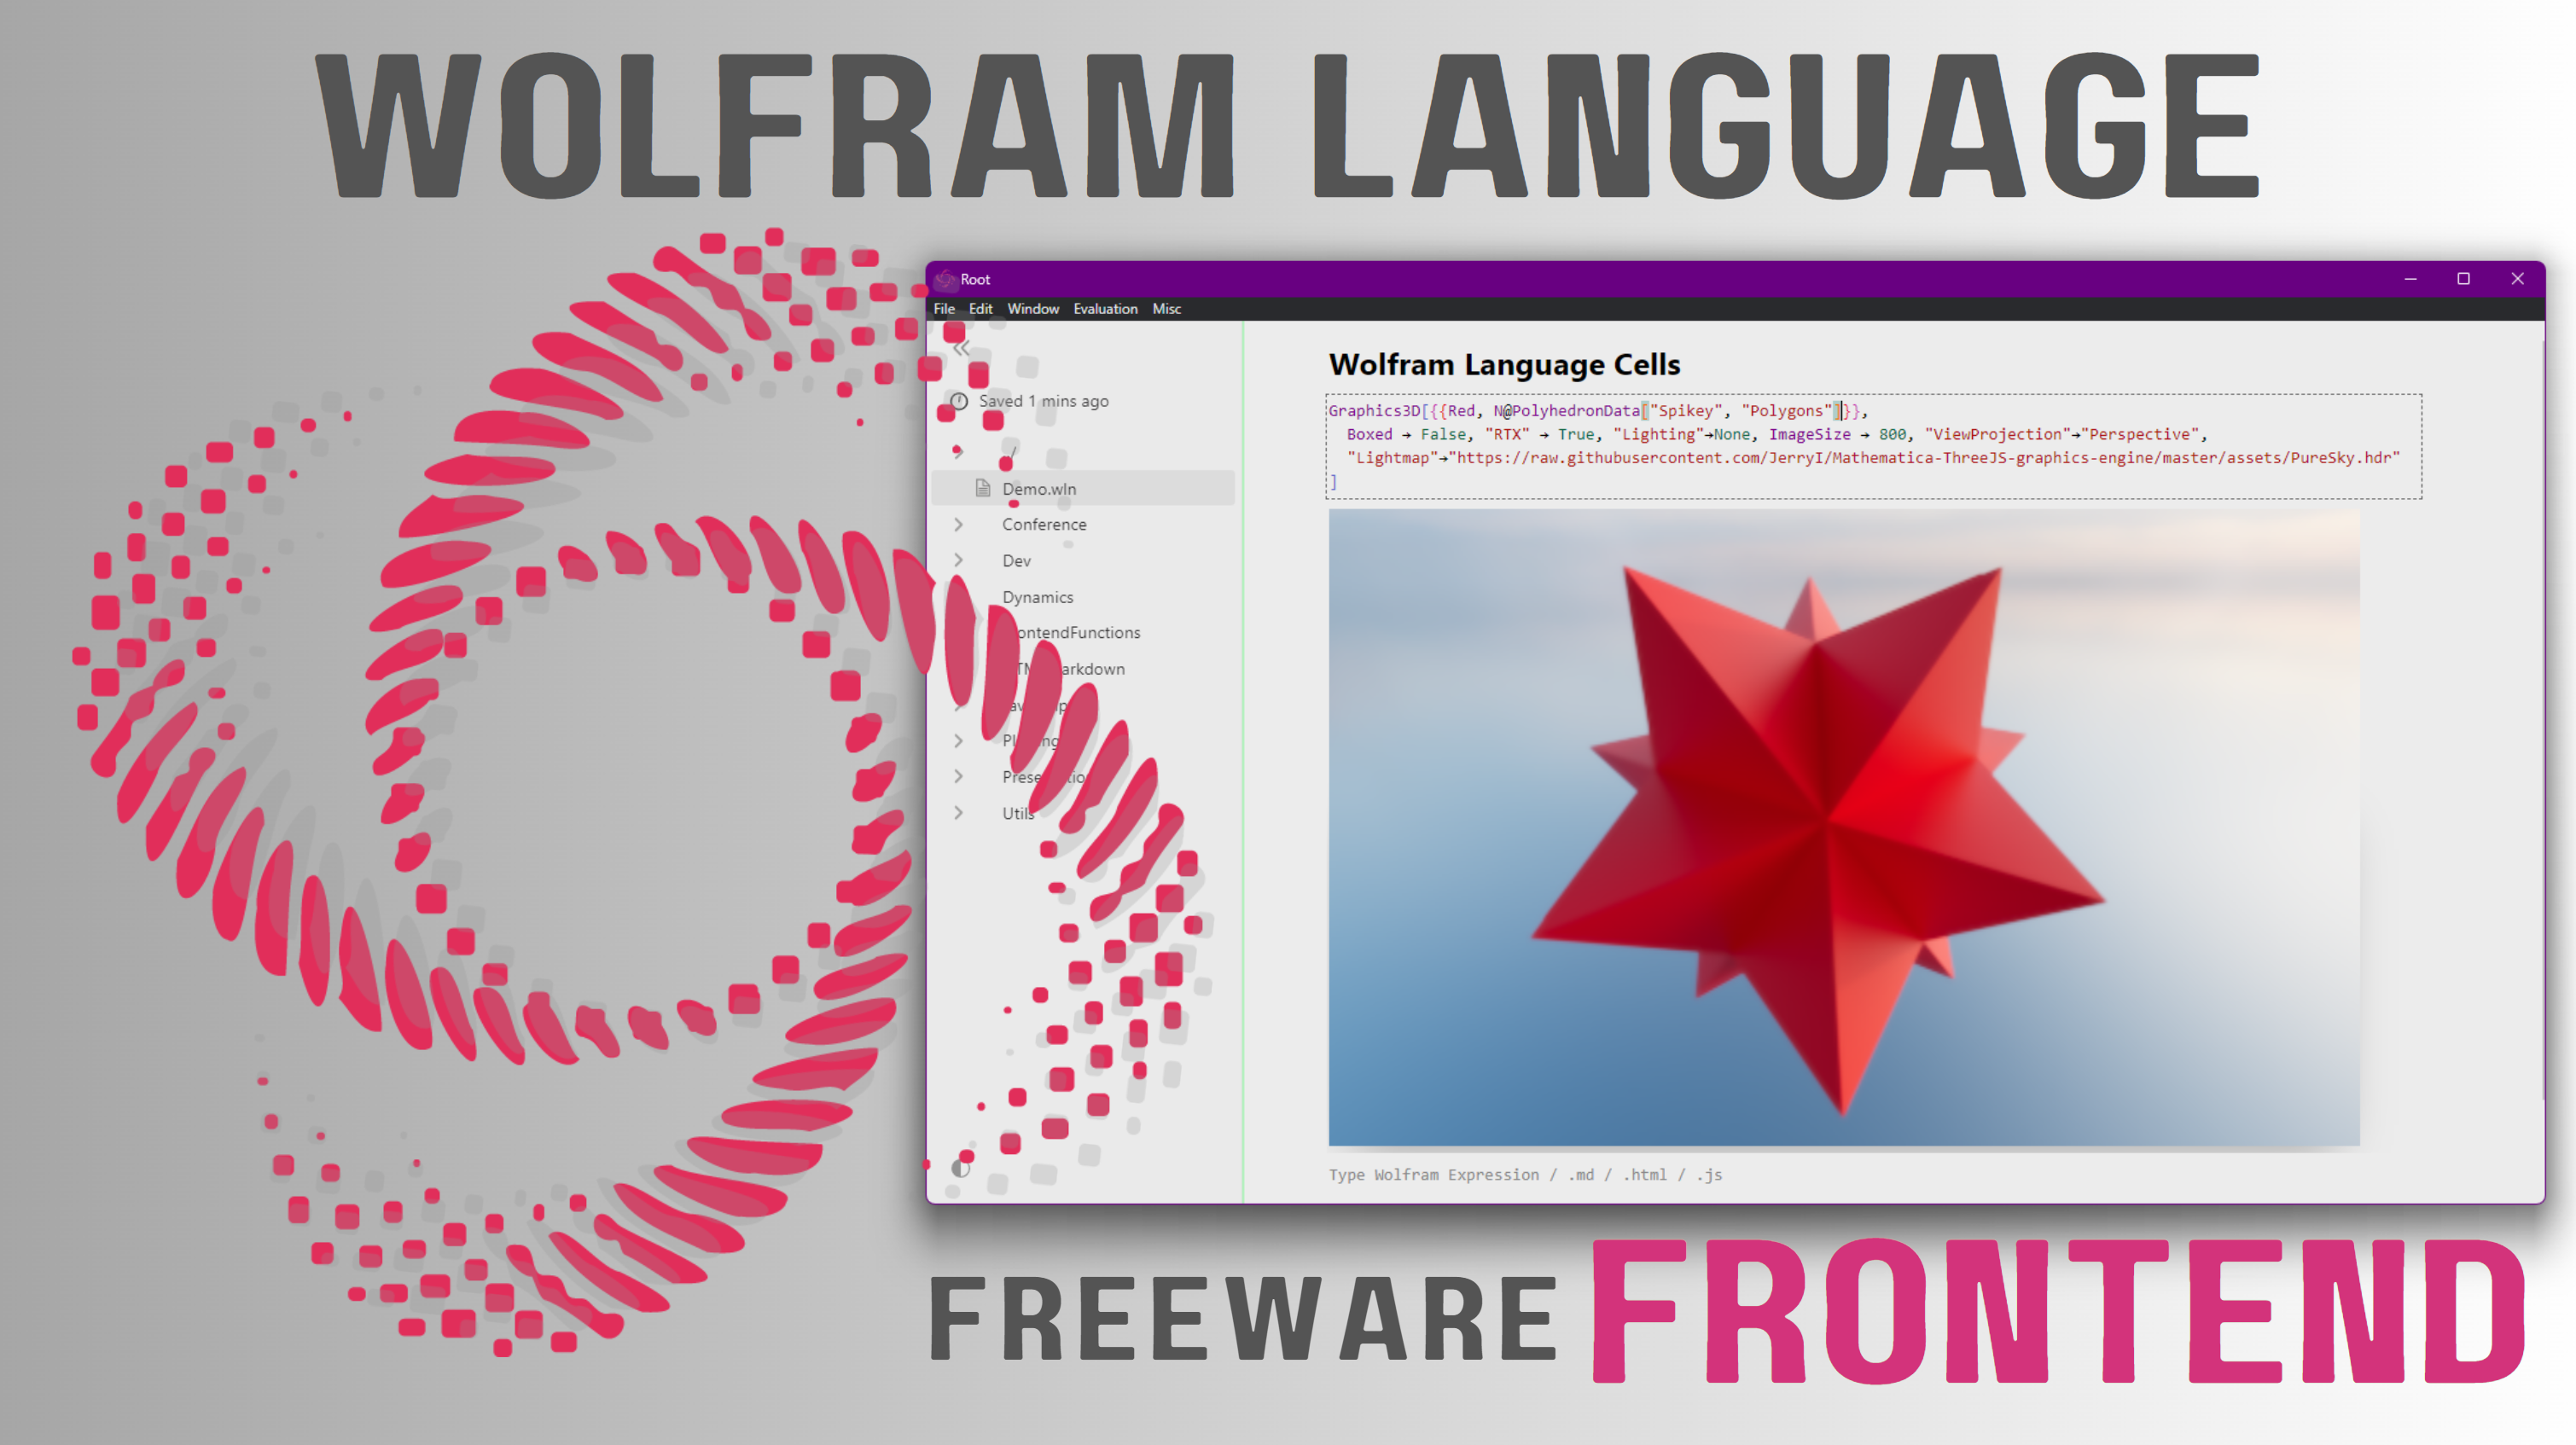
Wolfram Language JavaScript Frontend is a project that aims to create a free, open-source alternative to Mathematica with its own features and benefits, and more specifically, to implement a user interface for the Wolfram Language (WL) kernel. You can use the kernel included in Mathematica or the Wolfram Engine. So this application is just a user interface for WL, not an attempt to completely rewrite the language. Below is a demonstration of the features, as well as the differences from Mathematica and other applications. You will definitely find this interesting if you like the programming approach that platforms like Mathematica, Jupyter, NTeract, JupyterLab, DeepNote, ObservableHQ, Google Collab, and a few others use.
Installation
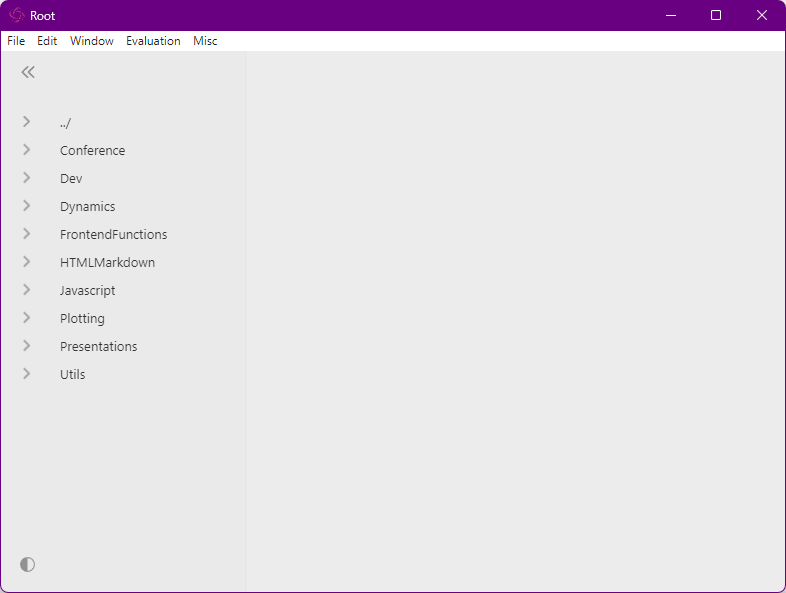
The main system requirement is Wolfram Engine or Mathematica. Then you can go to the release page and download an installer suitable for your system. Run the installer - first the application will be unpacked into the user directory, and then it will run. It is approximately the same as it happens with other applications on electron. Then you need to wait a bit until all dependencies are loaded and this window opens:
Main menu
It is intuitive and works about as a user would expect from most desktop applications.
- File - allows you to create, open, save, export a notepad
- Edit - cut, paste, delete, select
- Window - reloads the window and controls the size
- Evaluation - executes cell code, stops calculation and manages the kernel
- Misc - customizations and information
Especially worth noting is the File > Share item, which allows you to export Notepad to an HTML file, where all markup and interactive elements will be saved. Of course only those that do not require a connection to the core.
To create a notepad with a demonstration of features, go to the File > New menu or press the CTRL + N key combination. After that, a new file with a random name and the extension .wln - Wolfram Language Notebook - will appear in the left navigation area.
Navigation bar
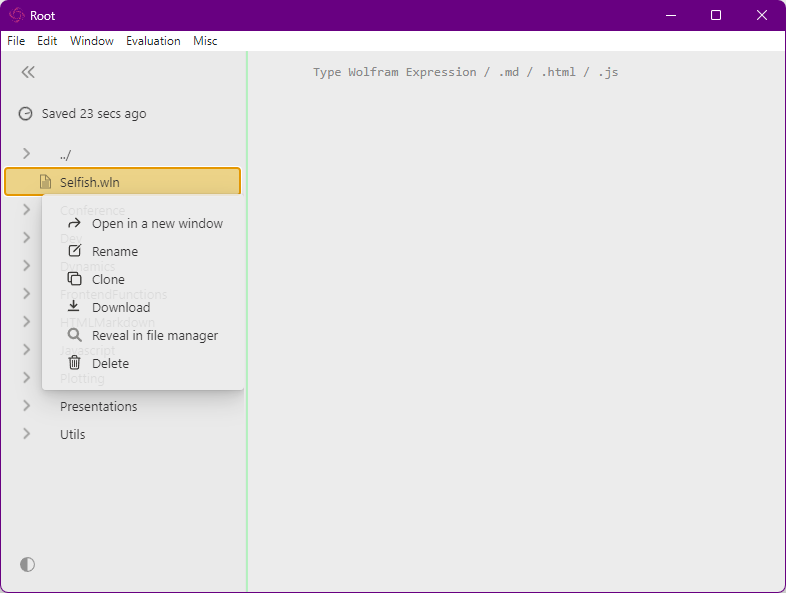
Navigation through files and directories is also very simple and intuitive. Directories can be opened. Files are opened on the main panel after clicking the left mouse button, and after clicking the right mouse button - a context menu appears, where the file can be opened in a separate window, renamed, copied, deleted, shown in the file manager. The navigator sidebar is minimized using the "<<" button. After moving to any directory, you can go back up a level by clicking on the top line in the navigator list with the name "../". On the screenshot, our new file is already open on the main panel of the window. There is nothing in it yet, except for one empty cell with a small hint.
Cells
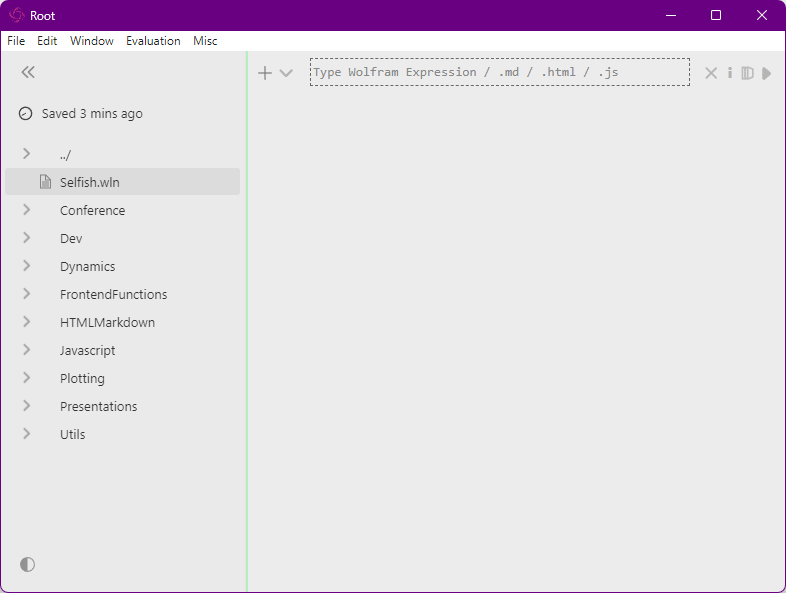
All notebooks contains list of cells and internal metadata. There is nothing else in them. There are different types of cells. First of all, they are divided into input cells and output cells. By default, the user can create only input cells using the keyboard and mouse. This is done either by clicking in the area between the cells in the document or by double-clicking the ↓ key in the last cell. Another way to create a new cell is by clicking on the + button that pops up when you hover over the area to the left of an existing cell. To delete, you must first delete all text and then press the BACKSPACE key.
The result of executing your code appears in the cells with the output. What will be there depends on what the user entered. It can be a graph, text, markup and much more. To create such a cell, just press SHIFT + ENTER in any input cell (if there is a code there, of course). Then the application will read the code of the cell, send it to the interpreter, wait for the response and print the result below. For example, this is what the result will be when this code is executed:
Graphics3D[Table[{RandomColor[],
  Sphere[RandomReal[1, 3], 0.05 + RandomReal[]/10]}, {25}]]
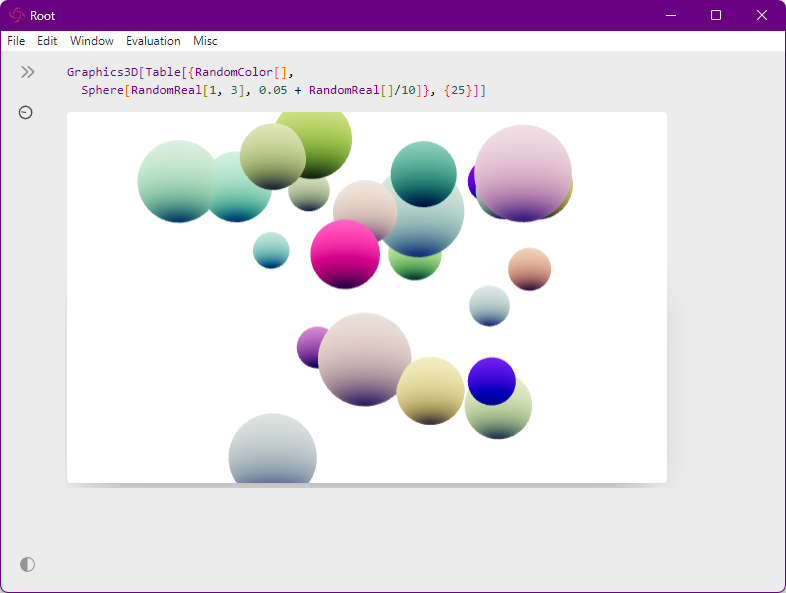
Notice the other popup buttons. In the lower left corner there is a down arrow that allows you to hide input, and in the upper right corner there are 4 more buttons in order: delete output, make initialization cell, detach result from window, and execute code (alternative to SHIFT + ENTER). If you execute the code again, the result will be replaced with a new one. In general, this is the main functionality of the application - interactive cells with code that immediately show the user the result. This is what we will focus on in more detail.
Wolfram Language
This is the main programming language supported here. After all, the entire backend is written in it. To write in this language, you don't need to do anything extra - just execute the code in the cell. For example, below is a demonstration of how to solve an equation:
Solve[x^2 + 9 * x - 1 == 0, x]
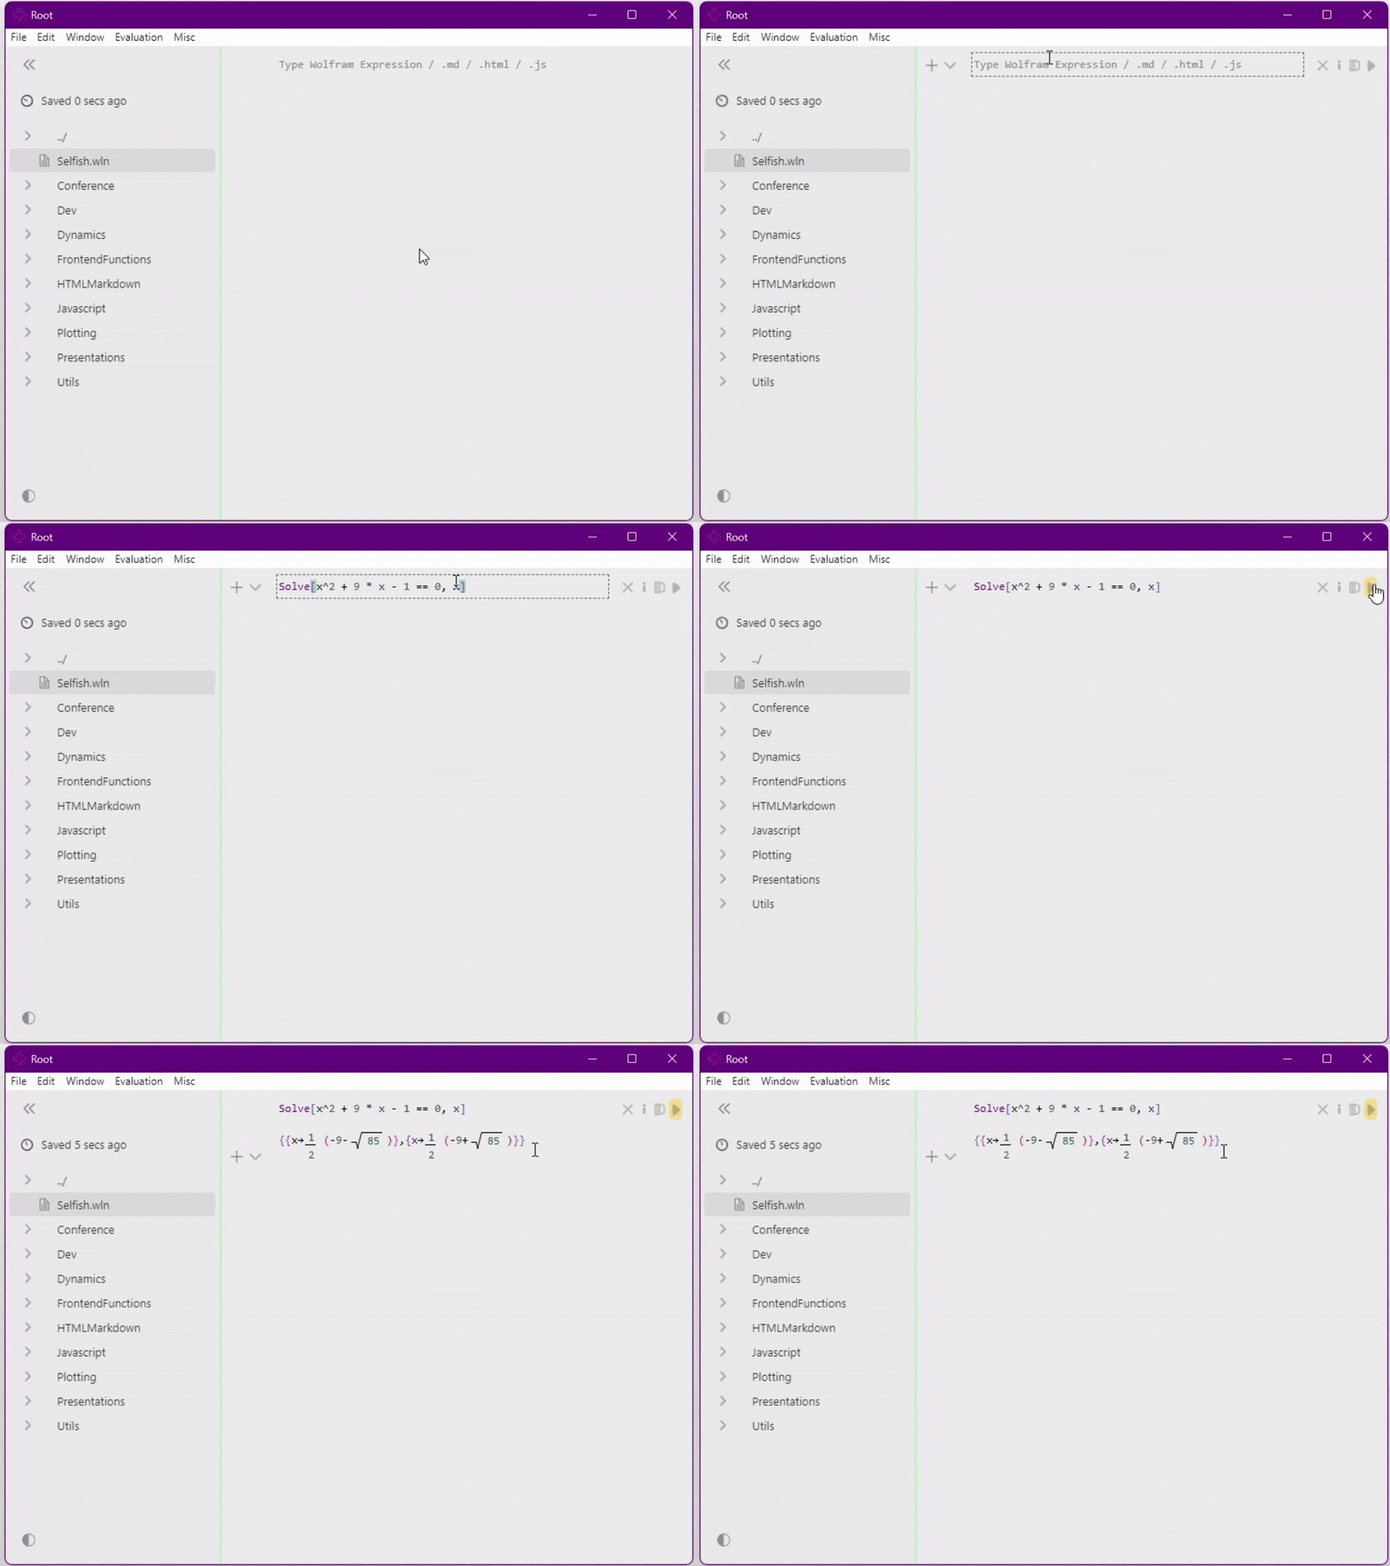
In the animation above, you can see that the text output is printed formatted. The roots of the equation contain a radical sign, and rational numbers are displayed as fractions. It is worth mentioning here that all this is possible due to the use of CodeMirror and wljs-interpreter JavaScript libraries. It is it that allows you to display formatted output so that under this output hides a completely different code without formatting - i.e. allow you to create syntactic sugar. And mathematical formulas are only a small and the most obvious part of this syntactic sugar.
It is worth noting that the concept of displaying mathematical formulas here is most similar to Mathematica, but different from other tools with a "notebook" interface, such as Jupyter, DeepNote, Observablehq, nteract, and so on. All formulas are not just pretty markup, but are editable WL expressions that can be modified directly in the output cells.
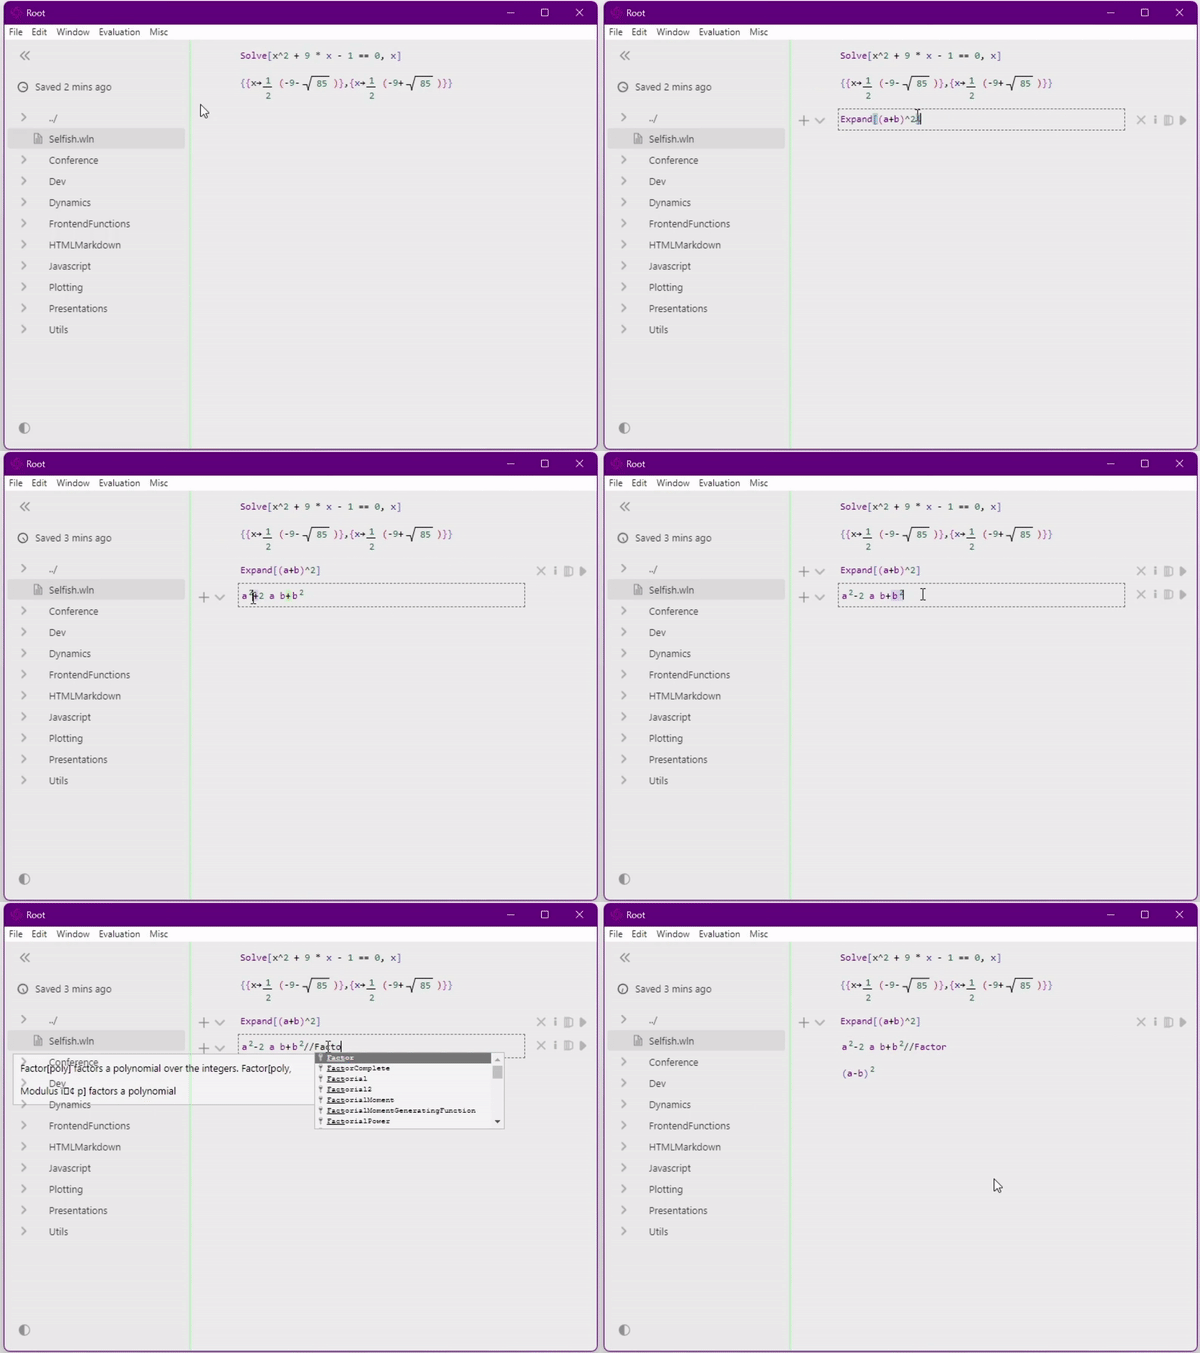
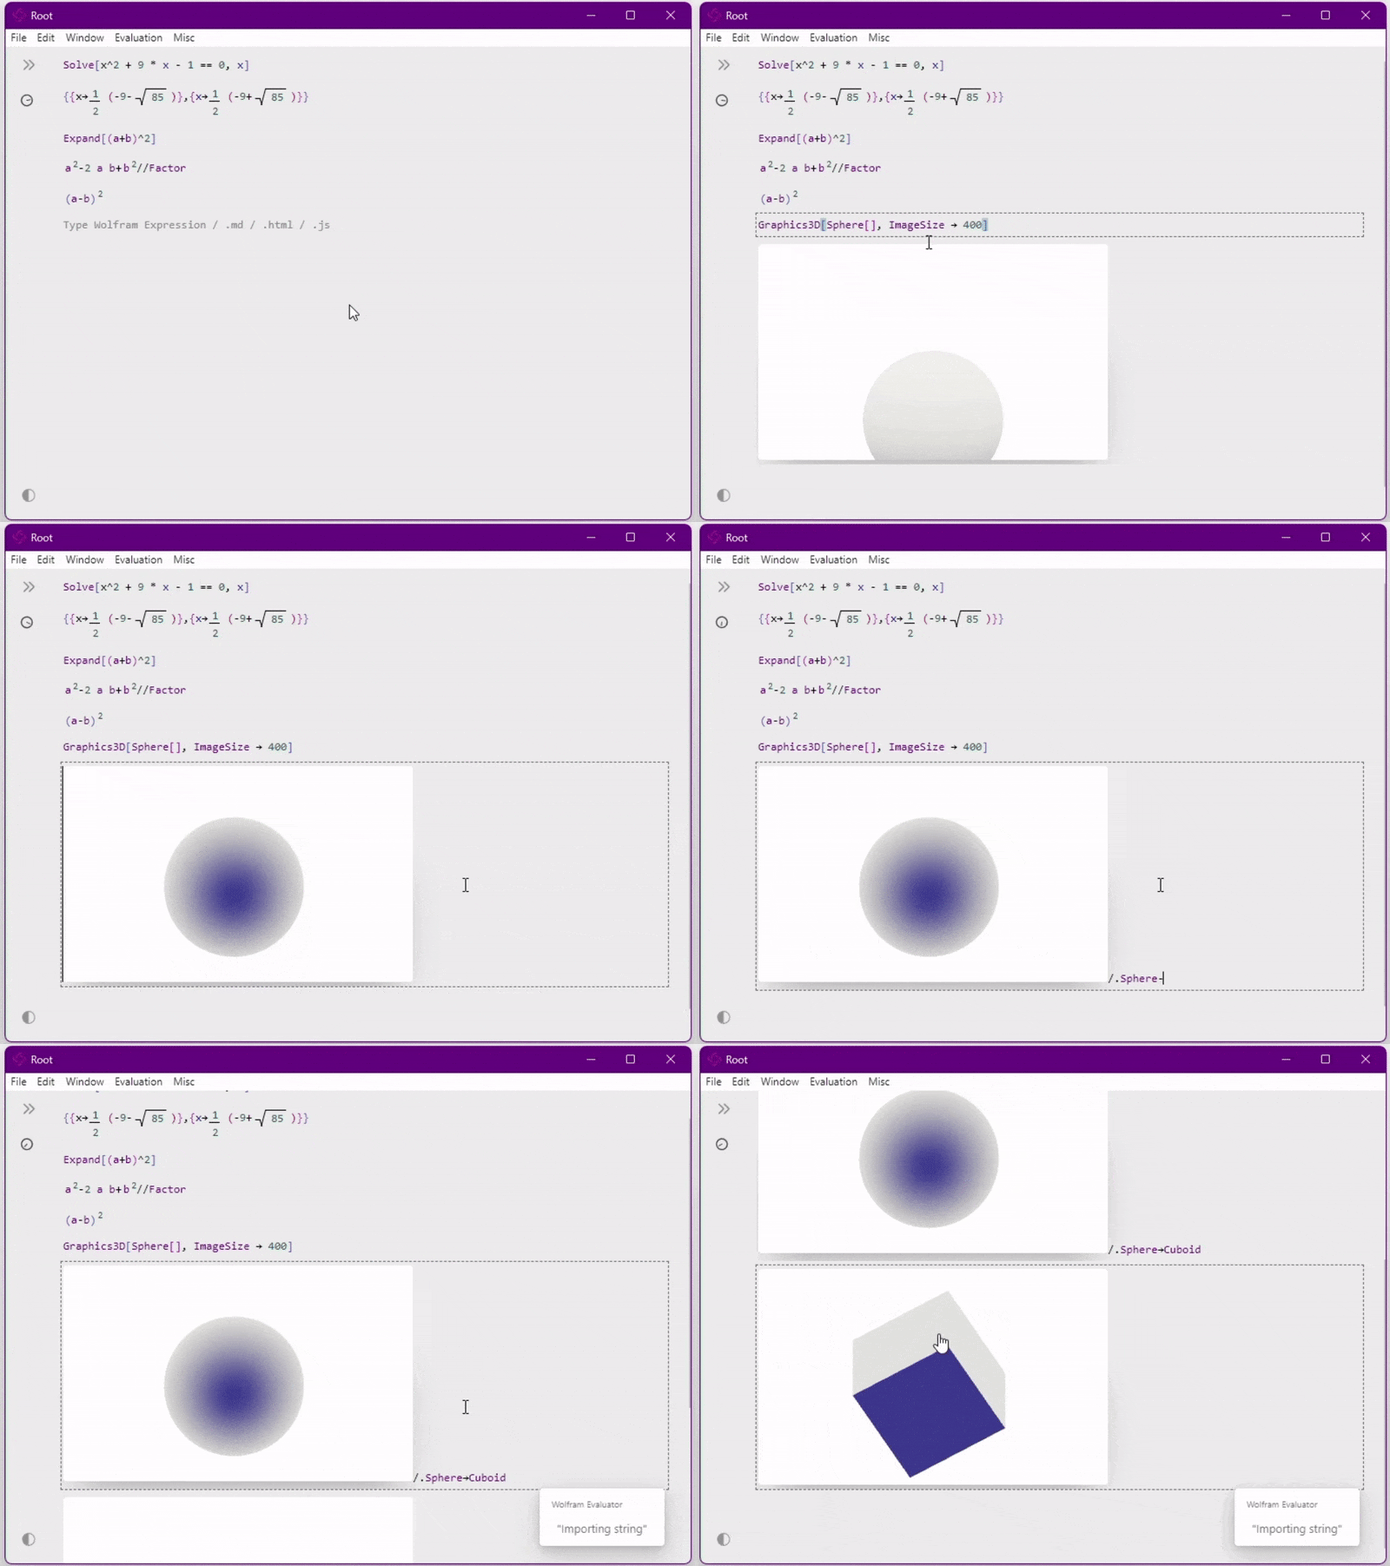
Not only formulas but any other objects are implemented using the same syntactic sugar and they too are supported by the editor:
Markdown
In addition to Wolfram Language support, the same input cells work with other programming languages and markup languages. In order to tell an application that a cell contains something that needs to be interpreted in a different way, it is necessary to enter a dot at the beginning of the cell, then the name of the language, and on the next line enter the code or markup itself. For example, for markdown it would look like this:
.md
# Demo notebook
## Markdown cells
_you_ *can* __hide__ **the** input cell using the ~pop-up~ `buttons`
on the [left side]()
## Supported languages
* Wolfram
* ect..
## Wolfram code example
(**)```wolfram
Plot[Sin[x], {x, 1, 2}]
(**)```
Then you just need to execute that cell and the output will show the formatted text:
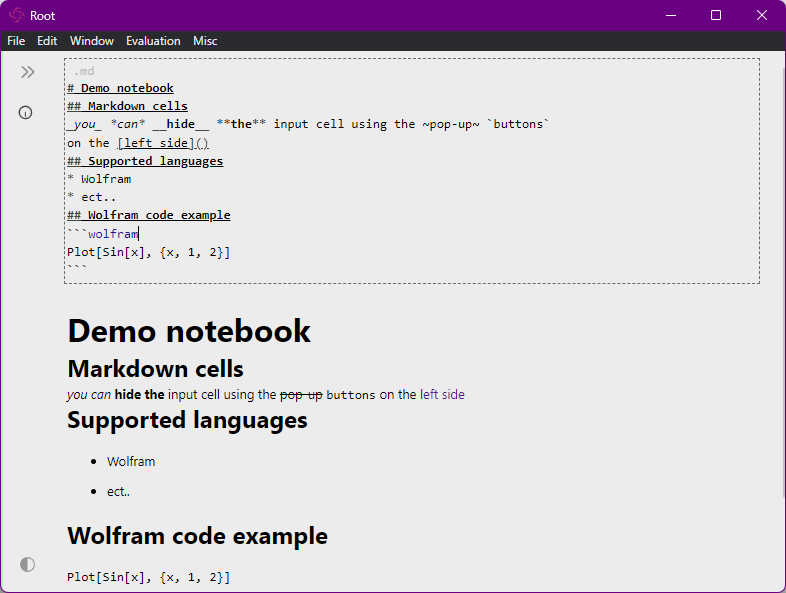
This way of typing can be thought of as if Notebook is a file editor and by specifying "extension" at the beginning we create an anonymous file whose text starts on the next line. We will come back to this comparison below, but for now let's move on to other supported languages.
JavaScript
This language is supported for obvious reasons - after all, the application is actually a web page packed in electron. As in the previous case, you just need to type "extension" in the first line, and then you can write code in JS. Below is an example of drawing circles on mouse click:
.js
const canvas = document.createElement('canvas');
const context = canvas.getContext('2d');
canvas.width = 300;
canvas.height = 400;
let x, y
const handleDrawCircle = (event) => {
  x = event.pageX;
  y = event.pageY;
  drawCircle(x, y);
};
const drawCircle = (x, y) => {
  context.beginPath();
  context.arc(x, y, 50, 0, 2 * Math.PI);
  context.strokeStyle = 'red';
  context.stroke();
};
canvas.addEventListener('click', handleDrawCircle);
return canvas;
Here's what it looks like in the notebook itself:
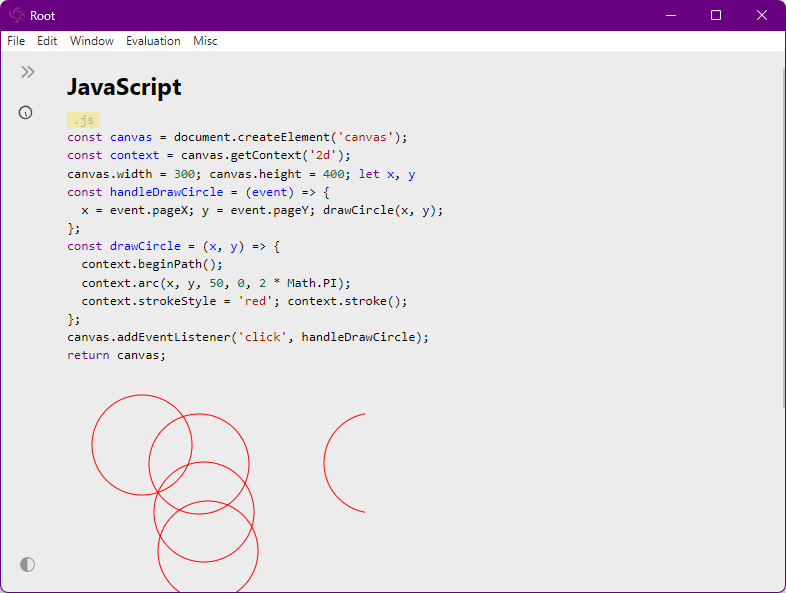
Important features of JavaScript execution inside Notebook:
- You must write return at the end of the cell to specify what to print in the output
- All code is essentially wrapped in a function and has local scope only within a cell. That is, any declared functions and variables are only visible in a single cell
- To create global functions and variables use the window object.
JS gives full access to the entire document. With scripts in cells, you can change the entire interface beyond recognition. But you can also break it completely with the first script.
HTML
If markdown markup doesn't allow you to do what you want - you can use HTML in the cells. Everything works exactly the same by specifying .html in the first line. All markup from the input cell inserts into the output cell as a page fragment:
.html
<button>click me!</button>
<select>
    <option>WL</option>
    <option>JS</option>
    <option>MD</option>
    <option>HTML</option>
</select>
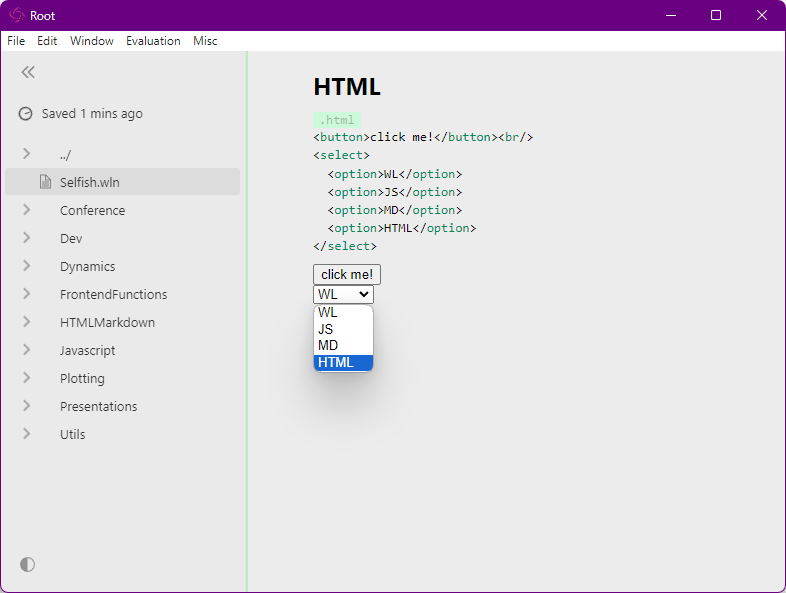
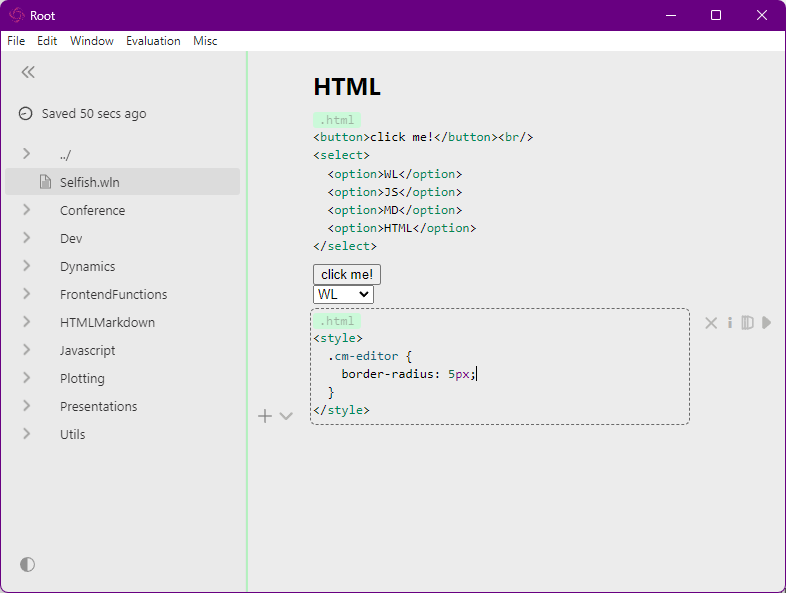
HTML cells have one very important advantage. Code that is embedded in the markup is executed to the global scope. This can be useful for creating JavaScript functions available throughout the document. But even more useful is that you can import third-party scripts and styles from the HTML markup, as well as modify the styles of the current document. This is how, for example, I can add a rounded border to all code cells:
.html
<style>
  .cm-editor {
    border-radius: 5px;
  }
</style>
WolframScript Pages
And the most important feature of HTML cells. They support WolramScript Pages (WSP) syntax by default. You can read more about the WSP technology itself on the project page, but in short, it is an extension of XML syntax with a special tag <?wsp code[] ?>, which inserts a WL expression into the markup - i.e., it's about the same as it works in PHP.
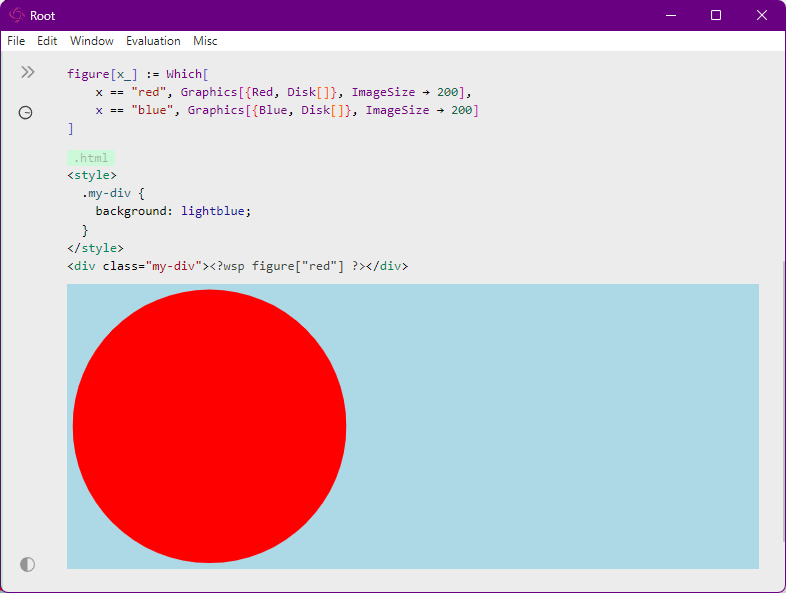
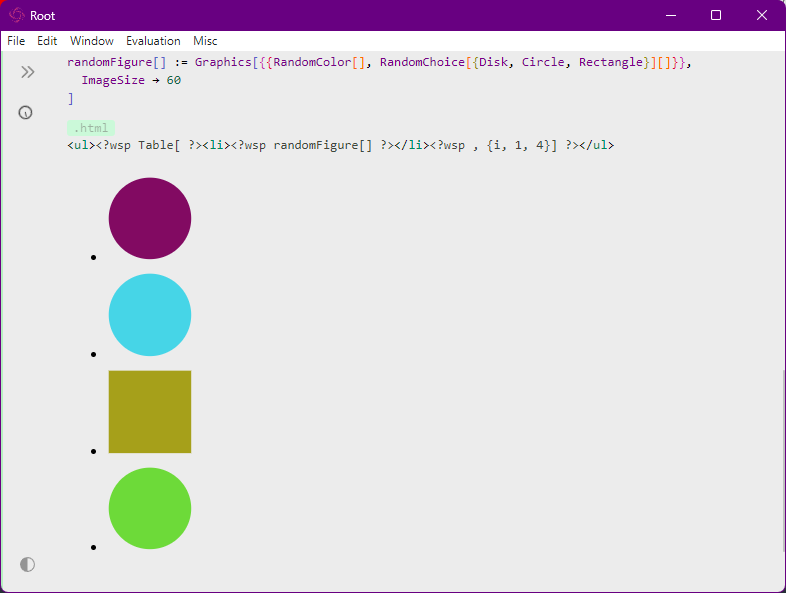
You can use almost any Wolfram language expression in WSP. You can insert functions defined inside Notebook, but most importantly, you can separate expressions with markup tags and then the text is mixed with code right inside the page. This is how, for example, you can create tables of several random shapes:
randomFigure[] :=
Graphics[{{RandomColor[], RandomChoice[{Disk, Circle, Rectangle}][]}},
  ImageSize -> 60
]
.html
<ul><?wsp Table[ ?><li><?wsp randomFigure[] ?></li><?wsp , {i, 1, 4}] ?></ul>
Wolfram Language XML Extension
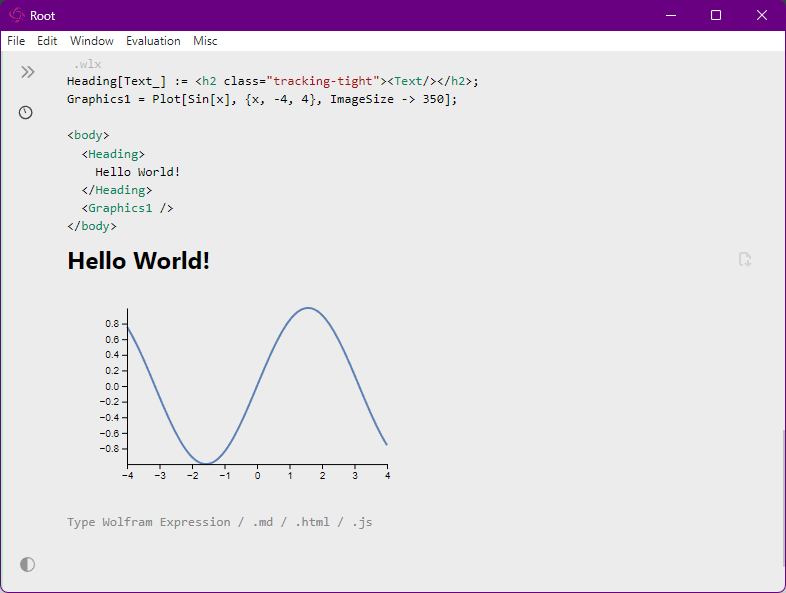
Another technology that mixes WL code with page markup. Only now it looks like PHP, but like JSX. That is, it works the other way around - we write WL code and can add markup to it. You can read more about this technology on the documentation page, and to create a cell in the first line we write .wlx. Below is an example of a chart with a header and all this in one cell:
.wlx
Heading[Text_] := <h2 class="tracking-tight"><Text/></h2>;
Graphics1 = Plot[Sin[x], {x, -4, 4}, ImageSize -> 350];

<body>
  <Heading>
    Hello World!
  </Heading>
  <Graphics1 />
</body>
Note the important features:
- WL functions declared in the document are available inside WLX markup
- Return the result enclosed in one common tag.
- All HTML markup tags always start with a lowercase letter.
- All tags that are converted into the result of WL execution are capitalized.
- To insert a variable use
<Name />
- To insert a function:
<Func>arg1 arg2</Func>
- You can easily import scripts and styles
Mermaid
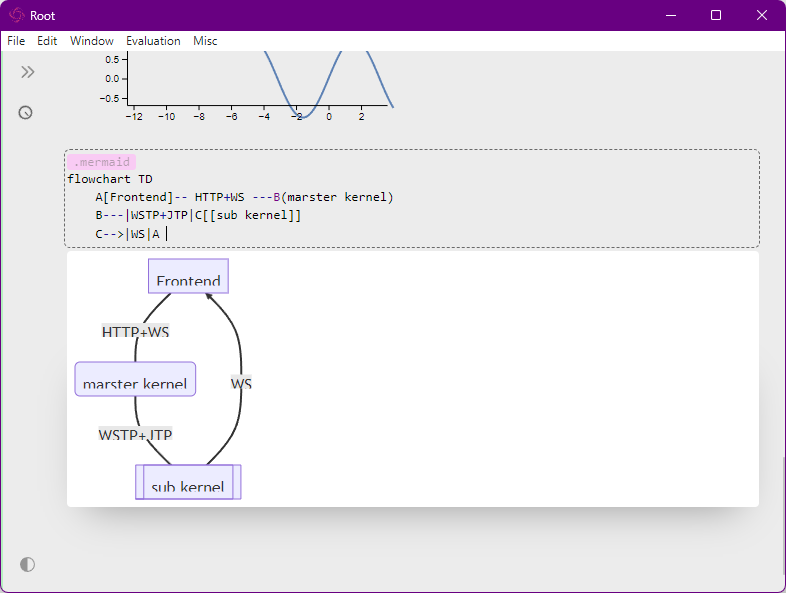
It's simple here. The Mermaid diagram support works on the basis of a JavaScript library. Here is for example a diagram that describes the backend of an application:
.mermaid
flowchart TD
    A[Frontend]-- HTTP+WS ---B(marster kernel)
    B---|WSTP+JTP|C[[sub kernel]]
    C-->|WS|A
Slides
Another markup "language" that is supported using the RevalJS library. In the first line we specify the cell type .slide or .slides, and then we can use the RevalJS presentation rules. The simplest presentations are created using .md markup and using HTML. Here's an example:
Graphics1 = Plot[Sin[x], {x, -2, 2}];

Graphics2 = Plot3D[Sin[x] + Cos[y], {x, -2, 2},
{y, -2, 2}];
.slide

# Slide 1

2D graphics

<Graphics1 />

---

# Slide 2

3D graphics

<Graphics2 />
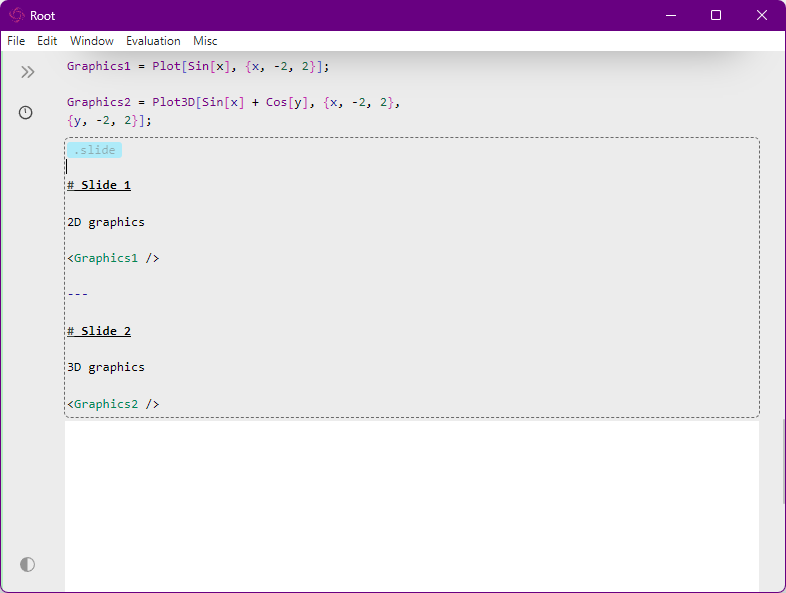
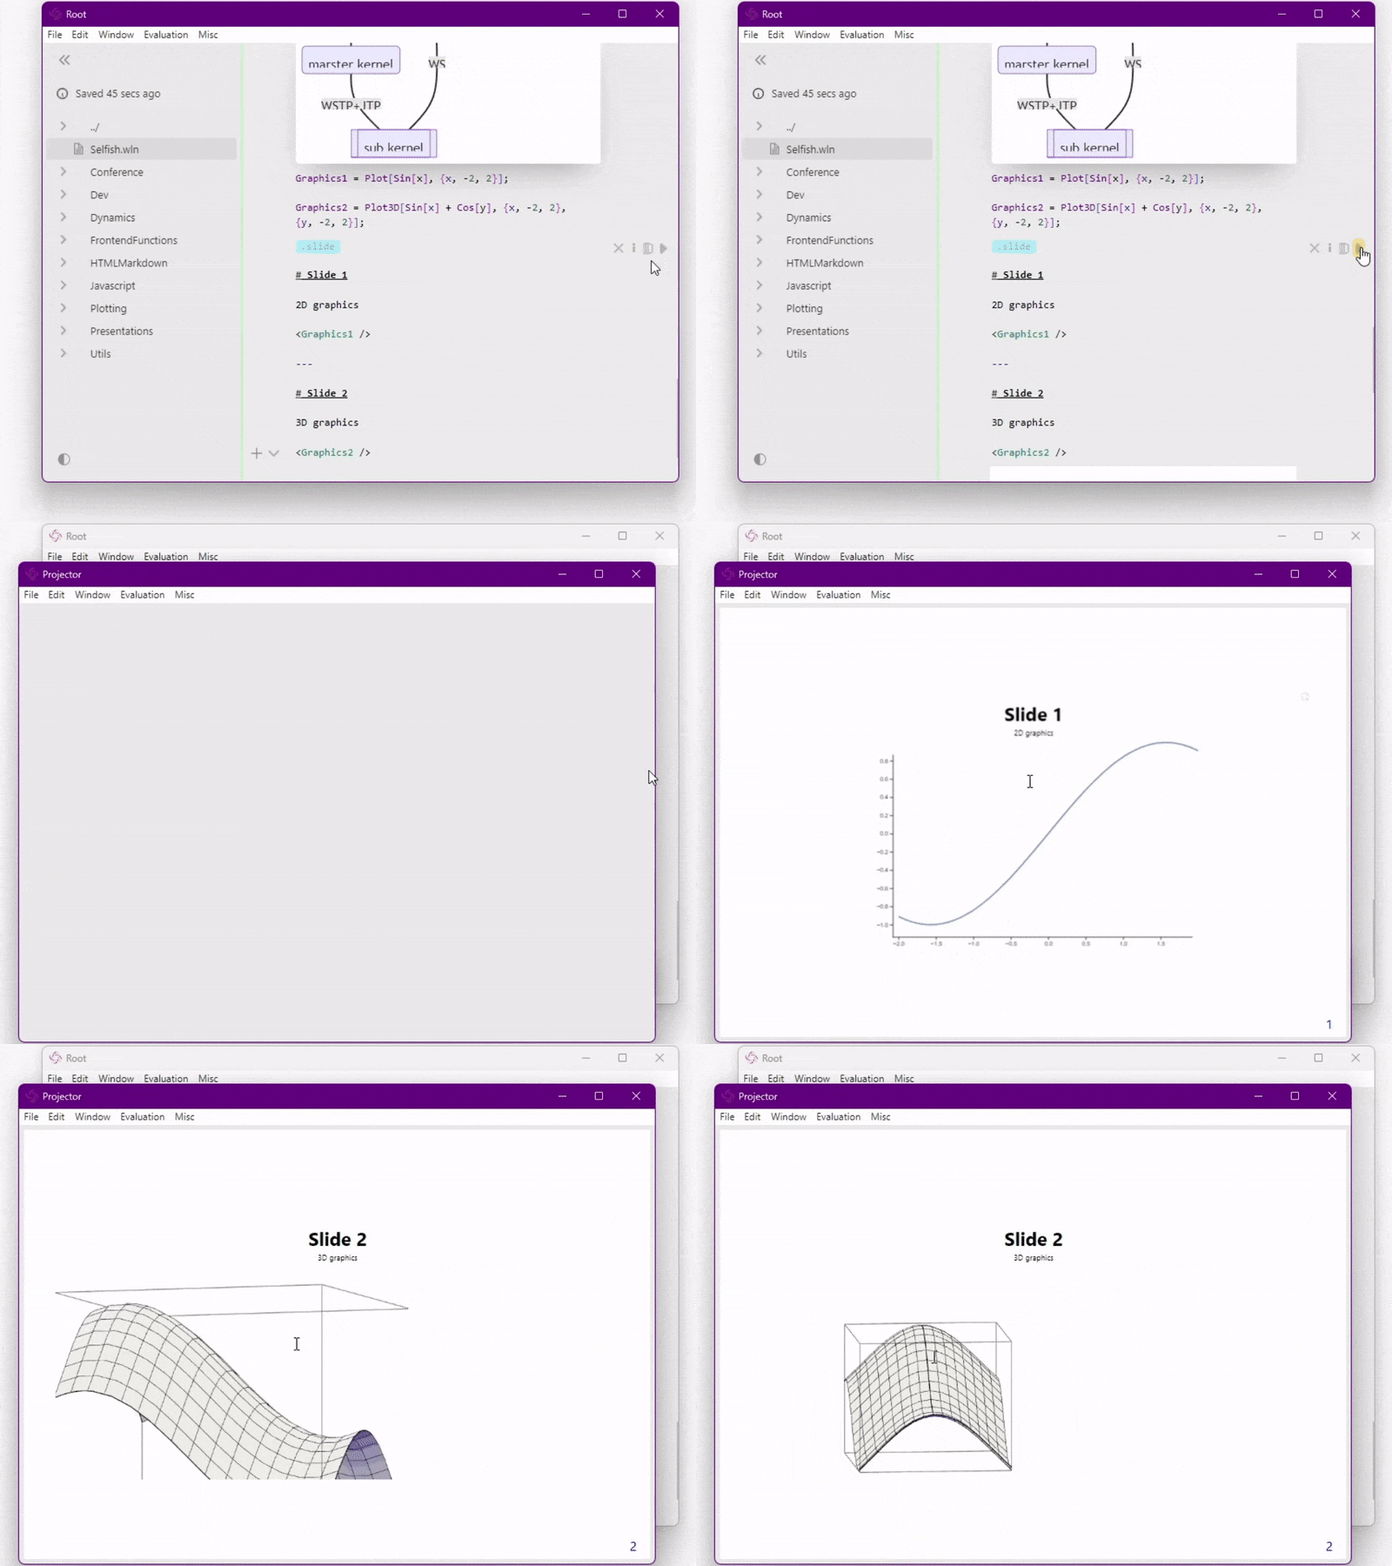
Note that HTML in slide markup supports WLX by default, which means that while writing a presentation you can create various objects: graphs, pictures and charts in Wolfram and insert them directly into the presentation. Once a cell with the result is printed, it needs to be "detach" to switch to the slide show mode:
ChatGPT
We couldn't resist the temptation not to join the general wave of hype - so we added the ability to communicate with the GPT3.5 model directly from Notepad cells. To do this, just type .llm in the first line and any text on the next line:
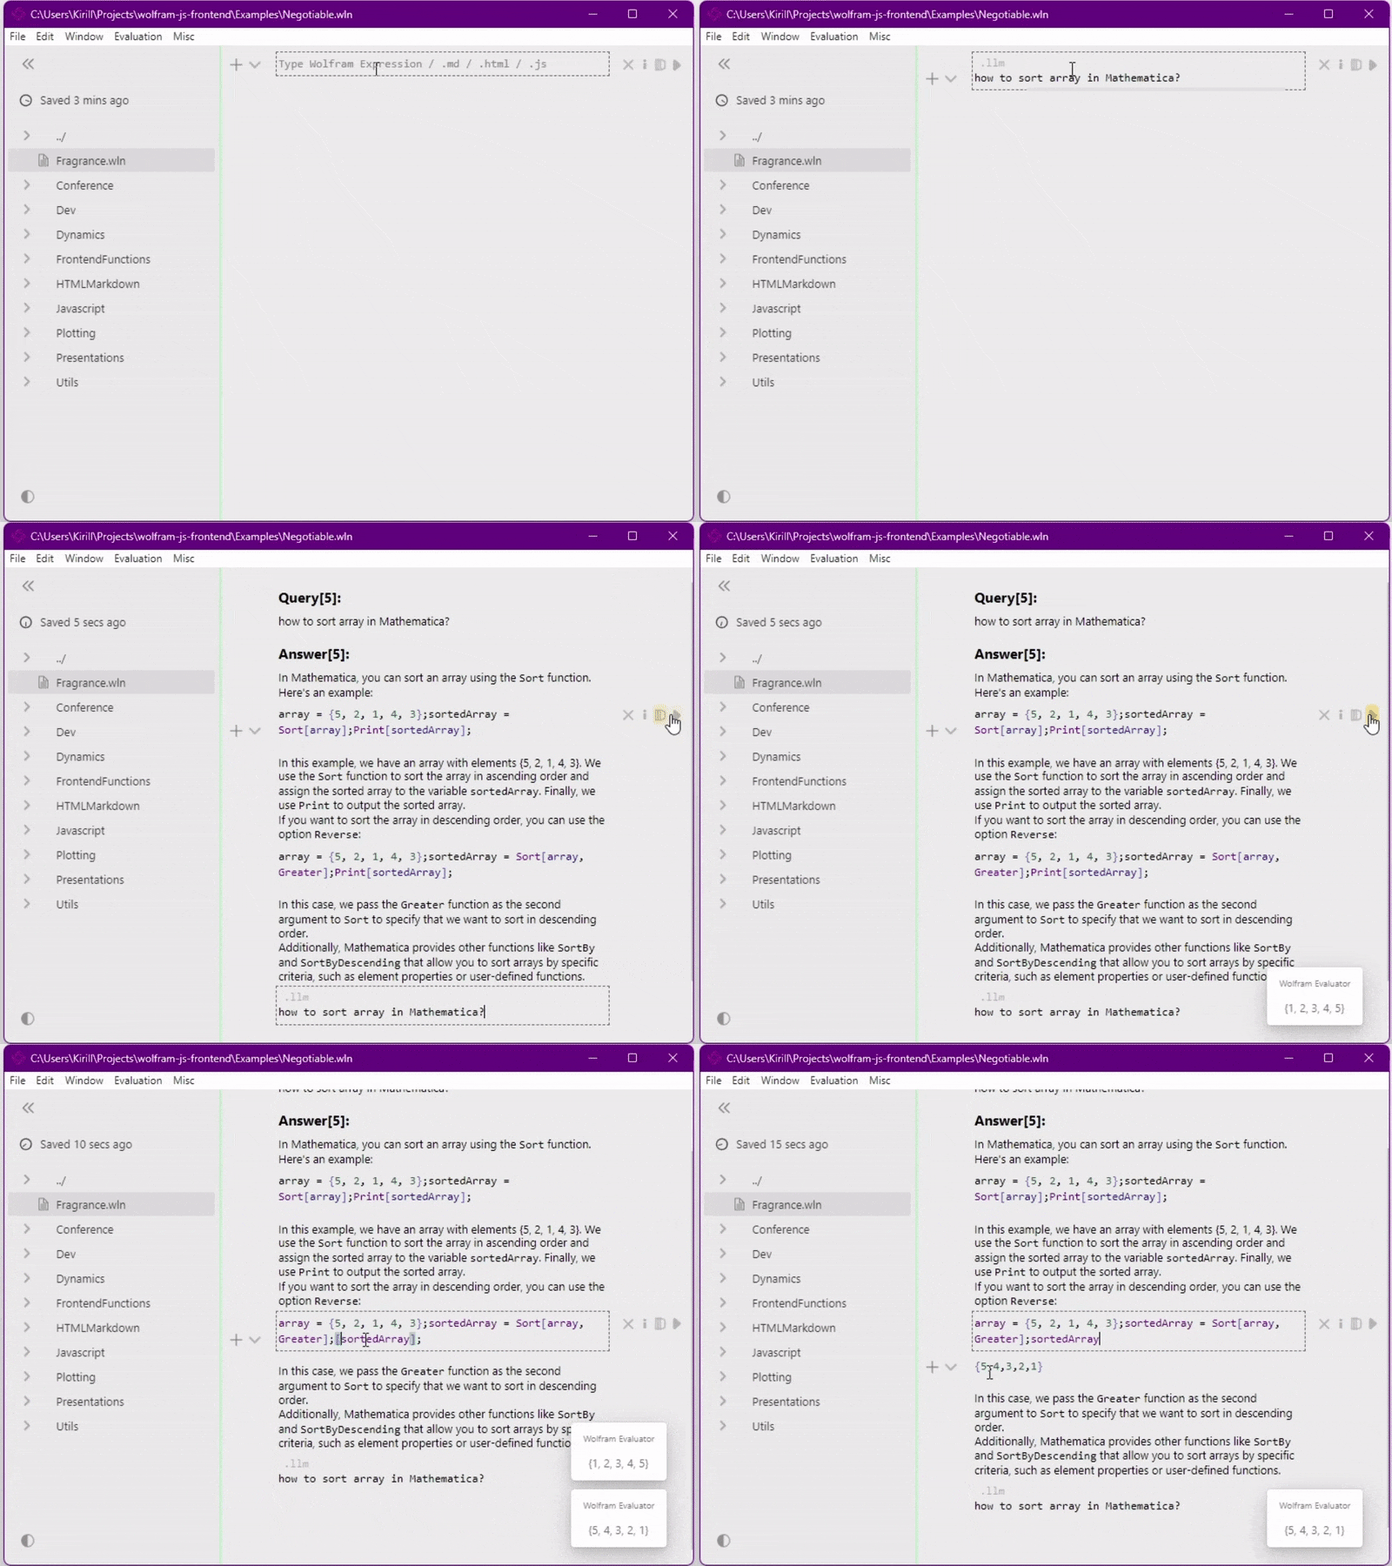
There are a couple of interesting features in cell-dialogs with a neural network:
- The neural network's response is printed as a set of cell pairs: input + output
- If the text is bad somewhere - you can easily edit the input and re-execute it
- If the neural network responds with code in .md markup - it turns into input without output
- All output is printed above the input cell, thus simulating the work of an assistant who fills in input cells with you from top to bottom and executes code in them.
- When the first input cell is shifted to the very bottom - it becomes like a normal dialog or ChatGPT interface.
Files
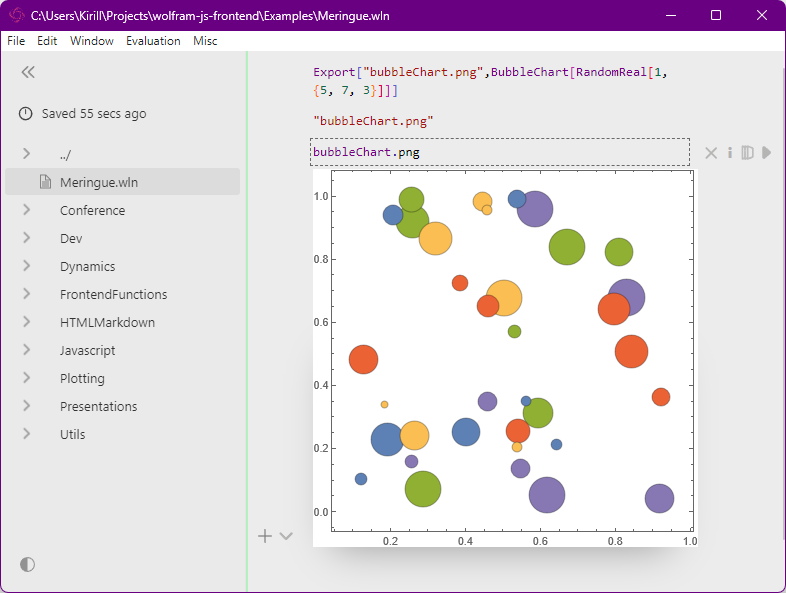
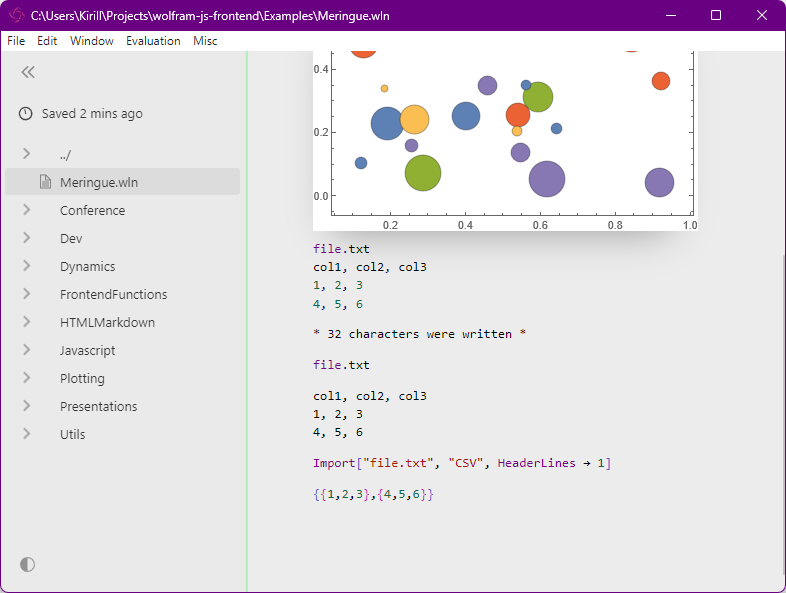
At the very beginning of the review there was a comparison with anonymous files inside a cell. So cells can not only create "anonymous files in notepad", but also read existing files! To do this, you need to enter a file name in the first line and execute cell. For example, below we will export a picture and then print it in the next cell:
Export["bubbleChart.png",BubbleChart[RandomReal[1, {5, 7, 3}]]]
bubbleChart.png
You can also write text files like this:
file.txt
col1, col2, col3
1, 2, 3
4, 5, 6
Then read
file.txt
And then they will be available for import by Wolfram Language functions:
Import["file.txt", "CSV", HeaderLines -> 1]
Conclusion and the headline image
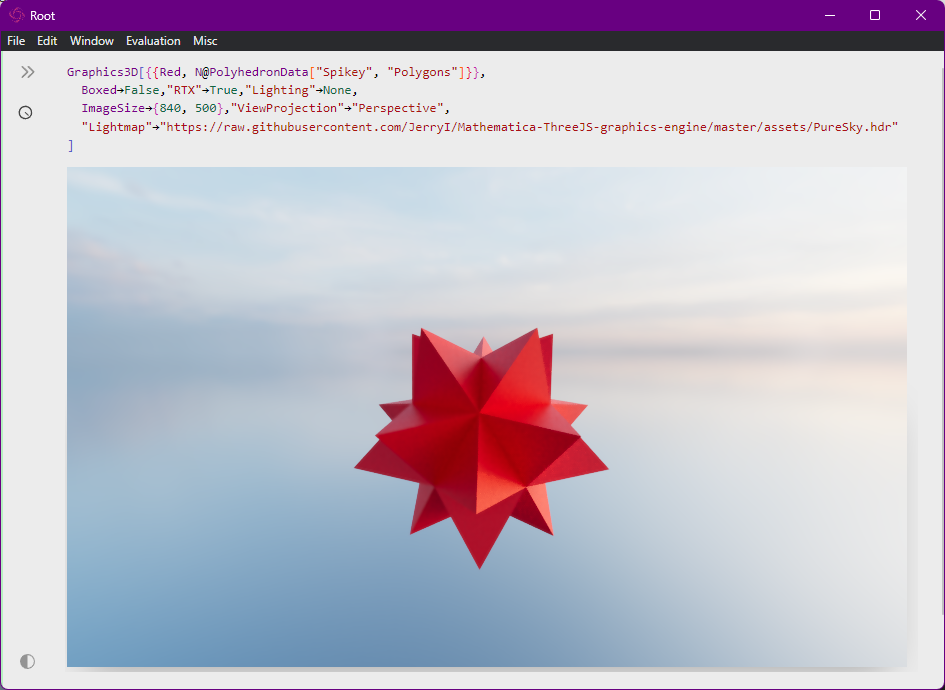
This concludes our review of the features of the free interface for Wolfram Language. This article did not cover all the features of the application, but only the most basic ones (not even all supported cell types). In addition to creating the interface itself, we (developers) also add our own useful features and plugins. Dear readers could see the result of such a function on headline image. In the picture, besides the logo and text, there is a real screenshot of a notepad with a 3D image of Spikey. So what's so special about this polyhedron? Well, the thing is that in the screenshot, this polyhedron is built using Graphics3D, but with ray tracing and HDRI lighting map (which has unavailable in Graphics3D inside Mathmetica). Here is the code that allows you to build a Graphics3D with Spikey and ray tracing:
Graphics3D[{{Red, N@PolyhedronData["Spikey", "Polygons"]}},
  Boxed->False,"RTX"->True,"Lighting"->None,
  ImageSize->{500, 400},"ViewProjection"->"Perspective",
  "Lightmap"->"https://raw.githubusercontent.com/JerryI/Mathematica-ThreeJS-graphics-engine/master/assets/PureSky.hdr"
]
That's definitely all for now! Thank you all for your attention and see you in the next articles and reviews! Our project is under active development and is constantly being updated. You can follow it on GitHub and on the documentation page. Freewawre Wolfram Language JavaScript Frontend developers Kirill Vasin (https://github.com/jerryi) and Kirill Belov (https://github.com/kirillbelovtest) were with you!