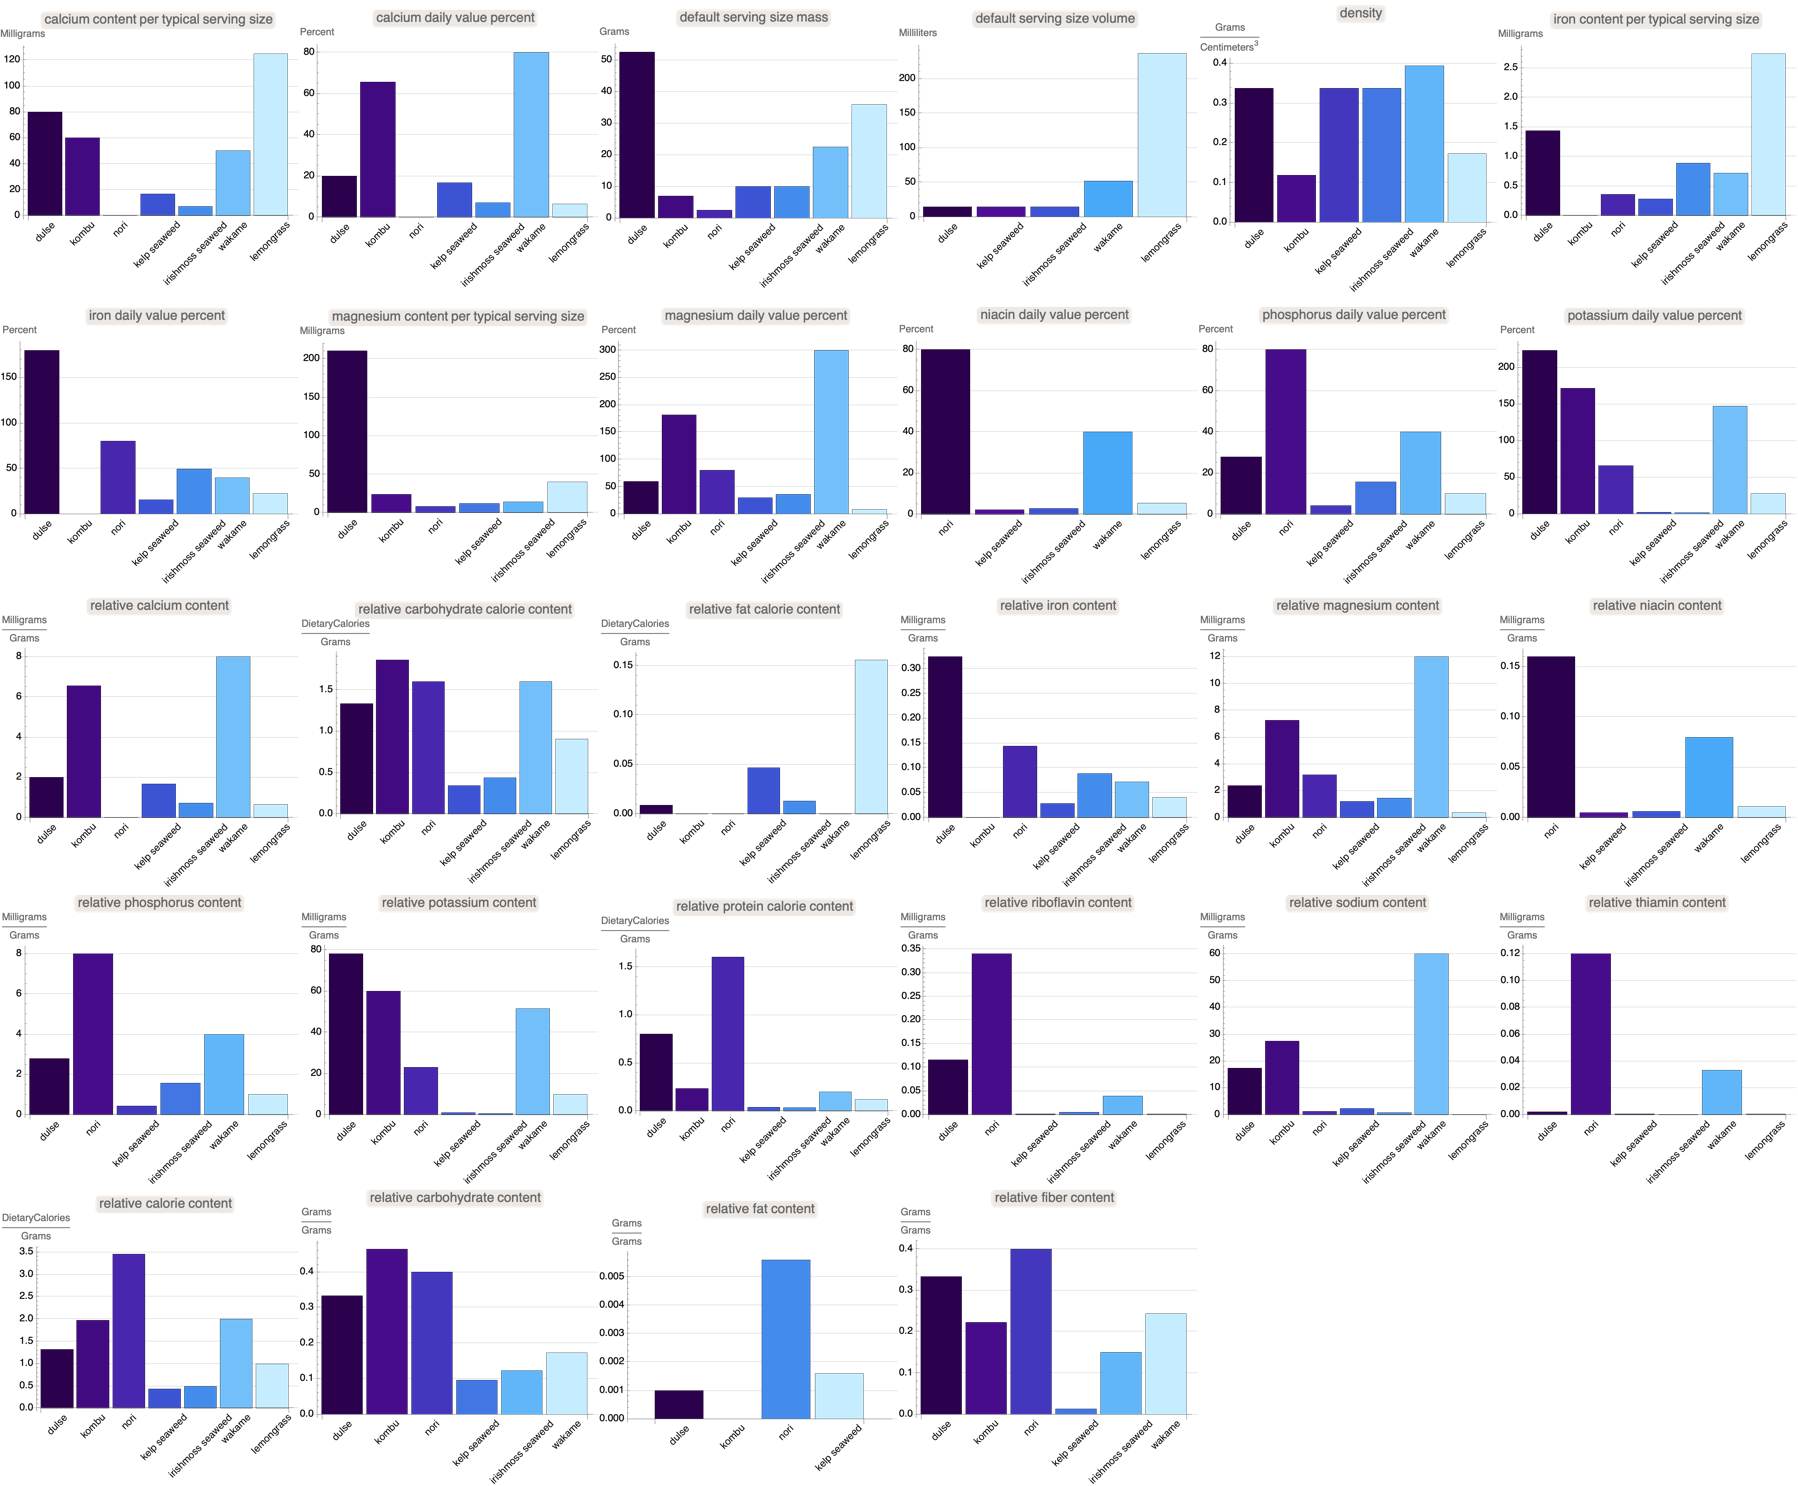
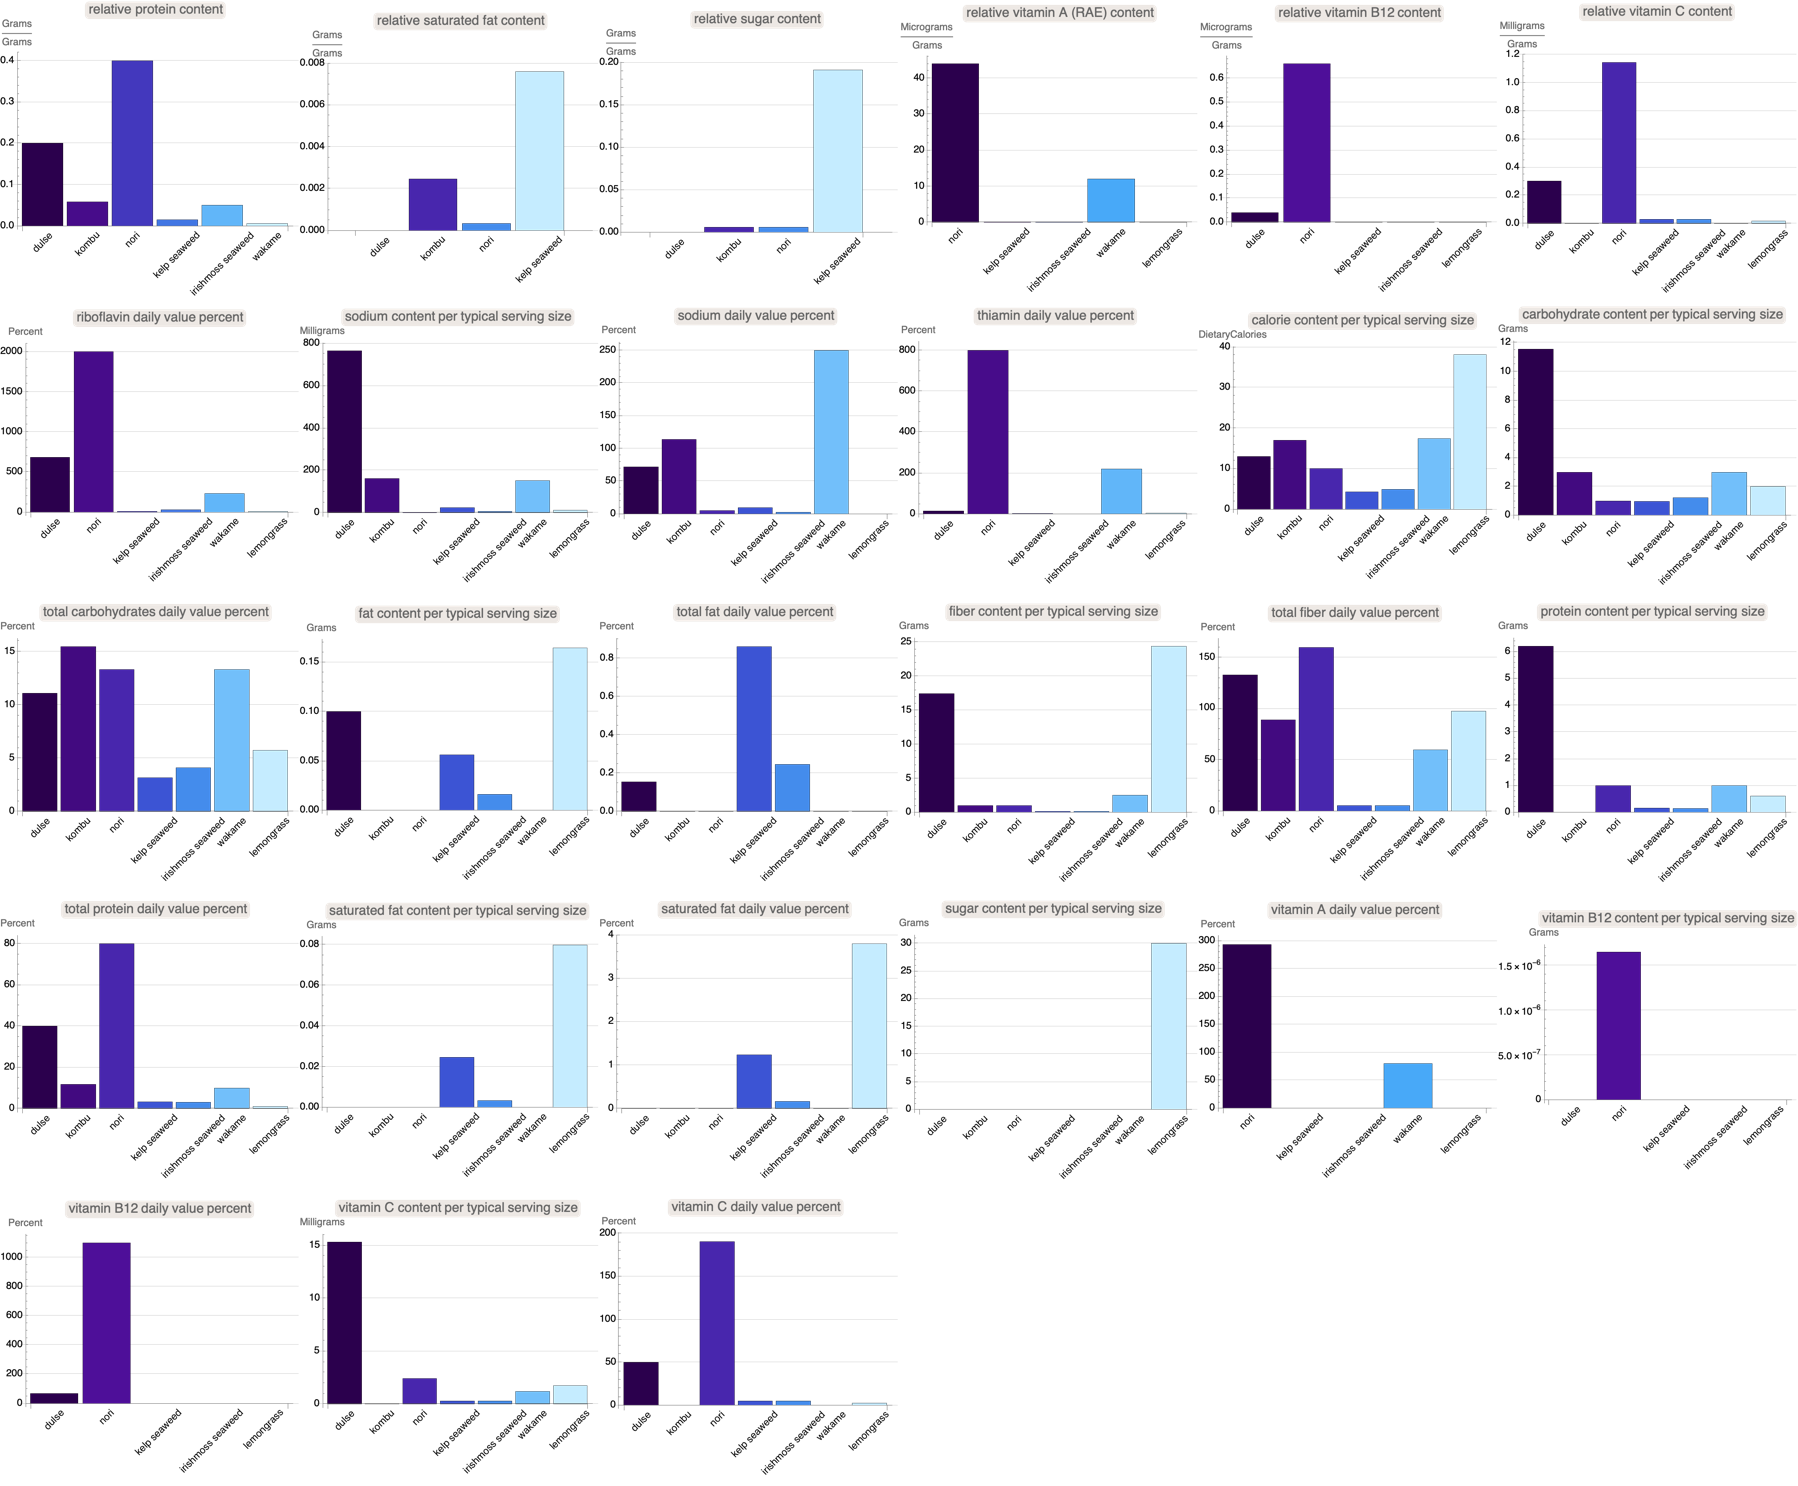
Yes, I mean--absolutely, these evaluations you've shared really illustrate the consistency and detailed comparison of nutritional content. We're beginning to focus on the magnesium and potassium content in sea vegetables and nuts, as well as a broader analysis of the vocabulary of nutritional properties in different foods.
foodTypeEntities = EntityList[EntityClass["FoodType", All]];
items = EntityValue[RandomSample[foodTypeEntities, 4], "Name"];
items = {"dulse", "kombu", "nori", "kelp seaweed", "irishmoss seaweed",
   "wakame", "agar-agar", "spirulina", "water spinach",
   "lemongrass"};
foodEntities = Map[Interpreter["Food"], items];
foodProperties = EntityProperties["Food"];
fetchFilteredPropertyHierarchy[items_, property_] := Module[
   {interpretedItems, propertyData, filteredData, labels},
   interpretedItems = AssociationThread[items,
     Map[
      Interpreter["Food"][#] &,
      items
      ]
     ];
   propertyData = Quiet[
     Check[
      AssociationThread[
       Keys[interpretedItems],
       EntityValue[
        Values[interpretedItems],
        property
        ]
       ],
      {}]
     ];
   filteredData = Select[
     propertyData,
     ! MatchQ[#, _Missing | {}] &
     ];
   labels = Keys[filteredData];
   {filteredData, labels}
   ];
handleDimensionlessQuantities[data_] := AssociationMap[
   If[
     QuantityQ[#] && UnitConvert[#, "DimensionlessUnit"] =!= #,
     QuantityMagnitude[UnitConvert[#, "DimensionlessUnit"]], If[
      QuantityQ[#] && UnitConvert[#, "g/g"] =!= #,
      QuantityMagnitude[UnitConvert[#, "g/g"]], If[
       QuantityQ[#], QuantityMagnitude[#],
       #
       ]
      ]
     ] &, data
   ];
standardizeQuantitiesToMicrograms[data_] := AssociationMap[
   If[
     QuantityQ[#] && UnitConvert[#, "Micrograms"] =!= #,
     QuantityMagnitude[UnitConvert[#, "Micrograms"]], If[
      QuantityQ[#], QuantityMagnitude[#],
      #
      ]
     ] &, data
   ];
visualizePropertyData[data_, labels_, property_] := Module[
  {convertedData, units, condition1, condition2, barChart1, barChart2},
  originalCondition = (Last[
       List @@ First[QuantityUnit /@ Values[data]]] == 1) &&
    (First[List @@ First[QuantityUnit /@ Values[data]]] == 1);
  condition2 = If[
    BooleanQ[originalCondition], originalCondition,
    False
    ];
  condition1 = ! condition2;
  convertedData = Which[
    StringContainsQ[ToString[property], "Percent"],
    handleDimensionlessQuantities[data],
    StringContainsQ[ToString[property], "g/g"],
    handleDimensionlessQuantities[data],
    True,
    standardizeQuantitiesToMicrograms[data]
    ];
  barChart1SuitsUnits = BarChart[
    Values[convertedData],
    ChartLabels -> Placed[Map[Rotate[#, Pi/4] &, labels], Below],
    PlotLabel -> Style[property, 16, Bold],
    AxesLabel -> {None,
      Style[First[QuantityUnit /@ Values[data]], 12]},
    ChartStyle -> "DeepSeaColors",
    PlotRange -> All,
    GridLines -> Automatic,
    BaseStyle -> {FontFamily -> "Helvetica", FontSize -> 12}
    ];
  barChart2Suits1GramsGrams = BarChart[
    Values[
     AssociationMap[
      If[QuantityQ[#], QuantityMagnitude[#], #] &,
      Values[convertedData]
      ]
     ],
    ChartLabels -> Placed[Map[Rotate[#, Pi/4] &, labels], Below],
    PlotLabel -> Style[property, 16, Bold],
    AxesLabel -> {None,
      Style[First[QuantityUnit /@ Values[data]], 12]},
    ChartStyle -> "DeepSeaColors",
    PlotRange -> All,
    GridLines -> Automatic,
    BaseStyle -> {FontFamily -> "Helvetica", FontSize -> 12}
    ];
  If[condition1, barChart1SuitsUnits, If[condition2,
    barChart2Suits1GramsGrams, Null
    ]
   ]
  ]
allValuesZeroQ[data_] := Total[QuantityMagnitude /@ Values[data]] == 0;
barCharts = {};
Do[
  Quiet[
   Check[
    {data, labels} = fetchFilteredPropertyHierarchy[items, property];
    If[
     (Length[data] >= Length[items]/2 && ! allValuesZeroQ[data]),
     Print[Values[data]];
     Print[labels];
     Print[visualizePropertyData[data, labels, property]];
     AppendTo[barCharts,
      visualizePropertyData[data, labels, property]];
     ], Null
    ]
   ],
  {property, foodProperties}
  ];
half = Ceiling[Length[barCharts]/2];
biggerBarChart = Take[barCharts, half];
smallerBarChart = Drop[barCharts, half];
ImageCollage[biggerBarChart, Background -> None]
ImageCollage[smallerBarChart, Background -> None]
Given some more meaningful data, here's what we've been able to extract--via said foundation of computational food science we can understand the full nutritional profile of aquatic foods and how to make informed dietary choices and, we can provide some insight on this amazing topic. I'd love to hear your thoughts on these visualizations. I started out staring at the data for relative magnesium content in sea vegetables compared to nuts as well as the potassium content in various bivalves versus beef, and now I'm ready to incorporate a more comprehensive analysis. Here's the comparative view.

My own observation is that protein, fat, sugar, and vitamin contents are relatively similar across various food items whether it's sea vegetables or nuts. It "turns out" we can look at the relative nutritional contributions of each food item, and then add in stuff like calcium, iron, and fiber content. I found this to be quite a convenient platform what with the fact that the Wolfram Language provides the nutritional analysis and visualization of fish and various sea vegetables; these are the food entities that Wolfram Language recognizes. We can filter out empty or missing values via the standardize dimensionless, numericize quantities function that provides needful consistency in presentation of data in a readable format.

And so what we can do here for the users is vectorize all the food properties, fetch and visualize data for all kinds of interesting properties. I didn't want to do any matrix algebra and that is why these food property items (distinguished between percentages or "dimensionless"), I've standardized them to align with the micrograms unit type because once we start adding culinary variety we get many types of measurable unit quantities. Looking forward to your feedback and further discussion!