Data credit: Icelandic Met Office
Animated results (using techniques shown below) and how to generate them.
In 2010 the volcano Eyjafjallajökull erupted and shut down (among other things) transatlantic air travel for about six days. This time it is the volcano Bárðarbunga which appears to be ready to erupt. The Icelandic API web site http://apis.is is providing a useful service, by tracking all measured earthquakes and formatting them as JSON output, which is easily imported into the Wolfram Language. In this post I will make use of this data to visualize these earthquakes.
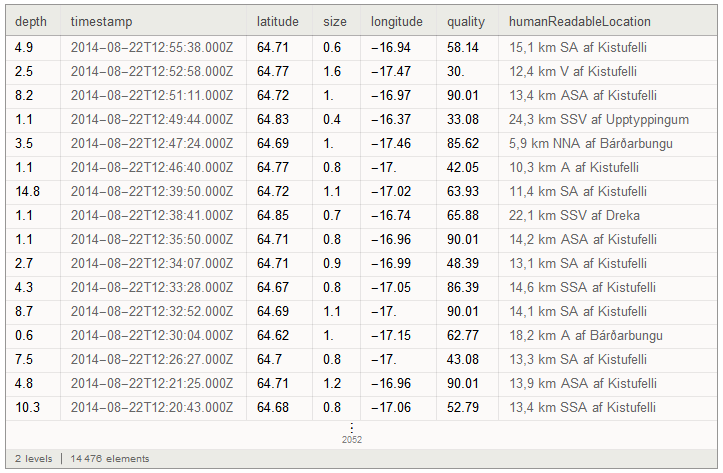
The first step is to import the dataset and to transform it into a Wolfram Language data structure aptly named Dataset.
dataset = Dataset[Map[Association, "results" /. Import["http://apis.is/earthquake/is", "JSON"]]];
We can inspect the content of this earthquake data by simply evaluating the dataset symbol:
dataset
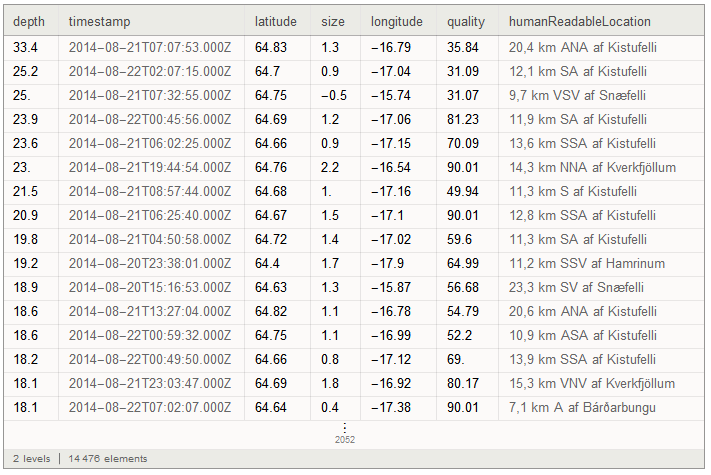
And we can also sort the data on any column, by using the SortBy function on the depth column. In this case I use -depth to sort from deepest earthquake to shallowest:
dataset[SortBy[-#depth &]]
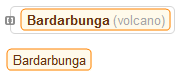
Now, let's make a geographical map of the area around Bárðarbunga. Here, we can use the natural language input which can be accessed by pressing the Ctrl key and the = key simultaneously. This brings up the natural language input field:

Now type in that field and hit the Enter key (followed by Shift-Enter to evaluate the input cell):
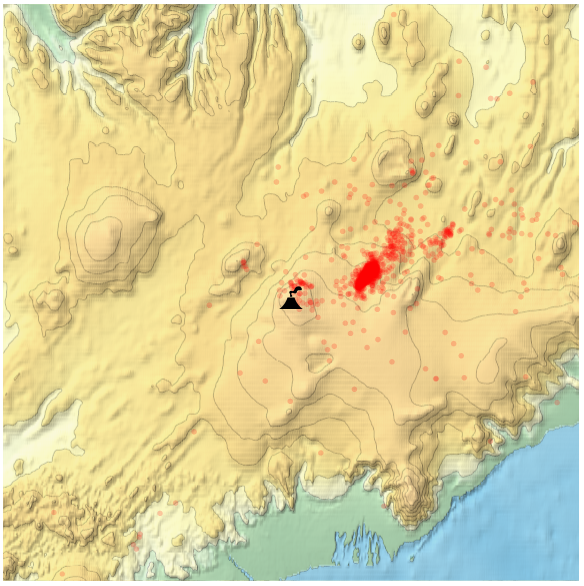
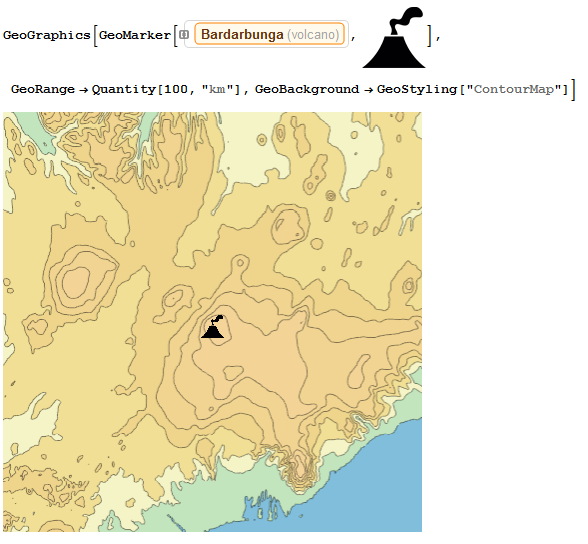
We can do this anywhere in the input, so now we can create a map of the area near Bárðarbunga. We use the GeoGraphics function and place a GeoMarker at the center of the volcano, using a iconic image for a volcano. We set the GeoRange to 100km to see the surrounding area including a piece of Iceland's coastline. For the map background we use the contour map styling:
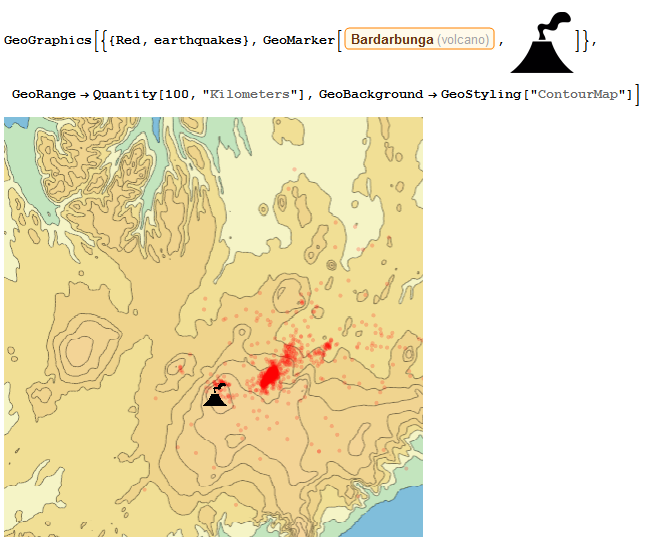
To get all the earthquake positions as little round disks, we extract the latitude and longitude from the dataset as values and then wrap them in GeoDisk with a radius of 1km:
earthquakes = Normal[ dataset[ All, {"latitude", "longitude"} /* Values /* (GeoDisk[#, Quantity[1, "Kilometers"]] &)]];
And then plot them as red disks on the previous map:
To make a slightly more refined image we can composite a relief map with a contour map and overlay the earthquake data (here volcanoimage is the image used above to indicate the volcano location):
reliefmap = GeoGraphics[
Entity["Volcano", "Bardarbunga"],
  GeoRange -> Quantity[100, "Kilometers"],
  GeoBackground -> GeoStyling["ReliefMap"], ImageSize -> Large];

contourmap =
 GeoGraphics[Entity["Volcano", "Bardarbunga"],
  GeoRange -> Quantity[100, "Kilometers"],
  GeoBackground -> GeoStyling["ContourMap"], ImageSize -> Large];

overlay =
 GeoGraphics[{{Red, earthquakes},
   GeoMarker[Entity["Volcano", "Bardarbunga"], volcanoimage]},
  GeoRange -> (GeoRange /. Options[contourmap, GeoRange]),
  GeoBackground -> None,
     ImageSize -> Large];

Overlay[{ImageCompose[reliefmap, {contourmap, .5}], overlay}]