Message Boards Message Boards

0
|
9023 Views
|
4 Replies
|
5 Total Likes
View groups...
Share
Share this post:

Counting points in a Graphic

Posted 10 years ago

Hey, I've been set a coding task at uni for my project and prefer to use Mathematica, was wondering if there was anyone who could help!

Is there is a way to set up a script that basically takes a graph of hundreds of points, creates a small circle at a point on that graph and then counts the points inside it. The loop would then create another circle slightly bigger and count those points within (I need two, one that cumulatively adds up the points and one that annularly does it), so that eventually one can plot a graph of radius of the circles against the points counted.

Thanks very much!

Lewis

POSTED BY: Lewis Millar
4 Replies
Posted 10 years ago
(* a list of 1000 points in a range *)
points = RandomReal[{-100, 100}, {1000, 2}];

(* select all points within distance of a point and count them *)
count[center_, distance_] := 
 Length[Select[points, Norm[# - center] <= distance &]]

(* make a table of these counts over a range and plot them *)
Table[{d, count[{0, 0}, d]}, {d, 1, 250, 5}] // ListPlot

enter image description here

(* choose a different center and do it again *)
Table[{d, count[{50, 50}, d]}, {d, 1, 250, 5}] // ListPlot

enter image description here

POSTED BY: David Keith

I assume you have generated the graph from a list of points. If so, then perhaps the best place to start is with a function that acts on a set of 2-dimenstional cartesian coordinates and determines the ones that are within a circle of radius r.

Let's say you have a bunch of points specified by their {x,y} coordinates. Here is an example of some random points within a square centered at the origin with sides of length 20 :

In[1]:= myPoints = RandomReal[{-10, 10}, {10, 2}]

Out[1]= {{9.46899, 0.761273}, {-6.23467, 0.511913}, {7.35649, 
  2.65914}, {2.29141, -4.28594}, {-1.70496, 0.849794}, {5.71018, 
  2.75263}, {3.8676, 3.89367}, {-2.3946, 
  8.70738}, {2.98544, -8.53176}, {-5.03731, -0.288273}}

Then the points contained within a circle of radius r can be determined by using the following function or something like it:

pointsInR[points : {{_, _} ..}, r_ /; r > 0] := Select[points, Sqrt[#.#] < r &]

Let's try it out:

In[5]:= pointsInR[myPoints, 8]

Out[5]= {{-6.23467, 0.511913}, {7.35649, 
  2.65914}, {2.29141, -4.28594}, {-1.70496, 0.849794}, {5.71018, 
  2.75263}, {3.8676, 3.89367}, {-5.03731, -0.288273}}

And the number of points within a radius r is given by the Length of this list:

In[9]:= Length[pointsInR[myPoints, 8]]

Out[9]= 7

And

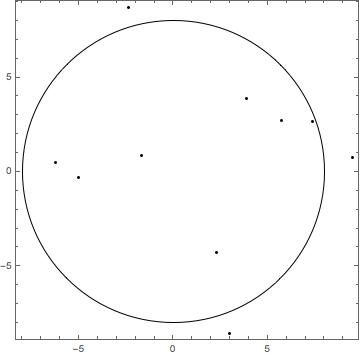
Graphics[{Point[myPoints], Circle[{0, 0}, 8]}, Frame -> True]

Gives

enter image description here

POSTED BY: David Reiss
Posted 10 years ago

Thanks for the reply! Is there any chance you could explain some of the terms in the part of the code that reads:

pointsInR[points : {{, } ..}, r_ /; r > 0] := Select[points, Sqrt[#.#] < r &]

I am not too sure what the {{, } ..}, r_ /; actually refers to, nor the #.# or &.

Thanks!

POSTED BY: Lewis Millar

Sure. I threw some of that in there in case you were not familiar with them so you could ask ;-)

In the left hand side of the function definition

pointsInR[points : {{_, _} ..}, r_ /; r > 0]

the

points : {{_, _} ..}

is indicating that the first argument, points, should have the pattern (http://reference.wolfram.com/language/tutorial/PatternsOverview.html) where it is a list of lists, each of which is a pair of values -- i.e., a list of cartesian pairs to comprise the coordinates of the points. It just restricts the function to only working when such a pattern is supplied. If you don't supply that pattern then the function will return unevaluated.

In a similar way, the second argument pattern

r_ /; r > 0

is just demanding that the radius argument be greater than zero--a sensible argument constraint given that the radius should be positive for the circle.

I could have written the function simply like this:

pointsInR[points_, r_] := Select[points, Sqrt[#.#] < r &]

but then, if you give it arguments of the wrong form, all sorts of havoc might be the result.

The

Sqrt[#.#] < r &

is an example of a pure function:

http://reference.wolfram.com/language/tutorial/PureFunctions.html

It is a way of defining a function to be used without having to name it. David Keith similarly uses a pure function in his discussion.

The # and the & are a shorthand for implementing a pure function. Another way of writing this, using the full Function form would be

Function[z,Sqrt[z.z] < r ]

I understand that this may give you a bunch of stuff to chew on, but it will be well worth learning these bits.

I hope this helps.

POSTED BY: David Reiss
Reply to this discussion
Community posts can be styled and formatted using the Markdown syntax.
Reply Preview
Attachments
Remove
or Discard

Group Abstract Group Abstract