I assume you have generated the graph from a list of points. If so, then perhaps the best place to start is with a function that acts on a set of 2-dimenstional cartesian coordinates and determines the ones that are within a circle of radius r.
Let's say you have a bunch of points specified by their {x,y} coordinates. Here is an example of some random points within a square centered at the origin with sides of length 20 :
In[1]:= myPoints = RandomReal[{-10, 10}, {10, 2}]

Out[1]= {{9.46899, 0.761273}, {-6.23467, 0.511913}, {7.35649,
  2.65914}, {2.29141, -4.28594}, {-1.70496, 0.849794}, {5.71018,
  2.75263}, {3.8676, 3.89367}, {-2.3946,
  8.70738}, {2.98544, -8.53176}, {-5.03731, -0.288273}}
Then the points contained within a circle of radius r can be determined by using the following function or something like it:
pointsInR[points : {{_, _} ..}, r_ /; r > 0] := Select[points, Sqrt[#.#] < r &]
Let's try it out:
In[5]:= pointsInR[myPoints, 8]

Out[5]= {{-6.23467, 0.511913}, {7.35649,
  2.65914}, {2.29141, -4.28594}, {-1.70496, 0.849794}, {5.71018,
  2.75263}, {3.8676, 3.89367}, {-5.03731, -0.288273}}
And the number of points within a radius r is given by the Length of this list:
In[9]:= Length[pointsInR[myPoints, 8]]

Out[9]= 7
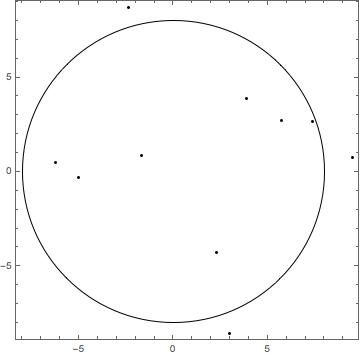
And
Graphics[{Point[myPoints], Circle[{0, 0}, 8]}, Frame -> True]
Gives
