Hi Vitaliy,
In general: YES. But with multiple photos you can guess. Let me explain:
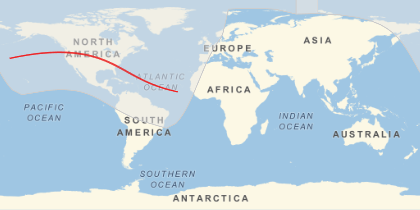
The path of the total solar eclipse can be obtained by:
GeoGraphics[{GeoStyling[None],
  SolarEclipse[DateObject[{2017, 1, 1, 0, 0}], "GraphicsData",
   EclipseType -> "Total"]}, GeoProjection -> "Equirectangular",
 GeoRange -> "World"]

Now the red line is where there is total eclipse. So for any given moment in time it is a 'point'. Now 90% coverage (at the same moment) will be seen by all the people a 'circle' around that point, and the same for 80%, 70% ....10%....
So for any given moment in time during the eclipse you will have people with 100%, and the further you go away from that point the coverage decreases.
Now from your photos we have different times, and different coverages. So for each time we can find the center of the eclipses, and plot those circles with the different coverages. Where these intersect, there should be your location.
If I knew the exact orientation of your camera I would only need 1 photo.
It is by no means an easy calculation, but we can do many simplifications and maybe somethings comes out of it.
Cheers,
Sander!