Message Boards Message Boards

From Ukraine: photo and map of the solar eclipse Mar 20, 2015

POSTED BY: Vitaliy Kaurov
15 Replies

Very nice pictures!!!

By the way, you can also compute how far is Odesa from the partial eclipse border:

GeoDistance[Entity["City", {"Odesa", "Odesa", "Ukraine"}], 
 SolarEclipse[DateObject[{2015, 3, 20}], "PartialPhasePolygon", 
  EclipseType -> "Total"], "DistanceFunction" -> "SignedBoundary"]

Quantity[-2005.09, "Kilometers"]

We can calculate the coverage (of the sun) for each of your photo. And inside the photo we can also find the time when it is taken. Using those 2 pieces of information we should be able to identify the location(s?) of your photo right? I.e. not using GPS, but using the coverage, and the times taken...

POSTED BY: Sander Huisman

For anyone looking for more resources ahead of the April 8, 2024, eclipse (especially Wolfram Language resources for computing and analyzing eclipses), check out Stephen Wolfram's new book "Predicting the Eclipse: A Multimillennium Tale of Computation". You get a copy on Amazon: https://www.amazon.com/Predicting-Eclipse-Multimillennium-Tale-Computation/dp/1579550878

POSTED BY: Paige Vigliarolo

Wouldn't it be cool if you could find your location just from the photos? I think this would be possible right? If you know the time and the coverage (image analysis), it should be possible right?

POSTED BY: Sander Huisman

Sander, do you mean without embedded in the image geotag? Because if the geotag is embedded then Wolfram Language extracts automatically. So what do you mean "coverage (image analysis)" - how the sun looks?

POSTED BY: Vitaliy Kaurov

Interesting idea. I wish I would know enough celestial mechanics to compute something like this.

POSTED BY: Vitaliy Kaurov

Here is the link: ZIP-Archive

POSTED BY: Vitaliy Kaurov

It's quite tricky, the coverage is the easy bit, but i need the moon-earth and sun-earth distance at the time around the event... It should be in the PlanetaryMoonData / StarData, but I can't get it to work... You'll hear from me...

POSTED BY: Sander Huisman

It gives me an impression as being a quite hard problem. Doesn't orientation of the chipped-off part of the Sun also matter?

POSTED BY: Vitaliy Kaurov

Hi Vitaliy,

In general: YES. But with multiple photos you can guess. Let me explain:

The path of the total solar eclipse can be obtained by:

GeoGraphics[{GeoStyling[None], 
  SolarEclipse[DateObject[{2017, 1, 1, 0, 0}], "GraphicsData", 
   EclipseType -> "Total"]}, GeoProjection -> "Equirectangular", 
 GeoRange -> "World"]

enter image description here

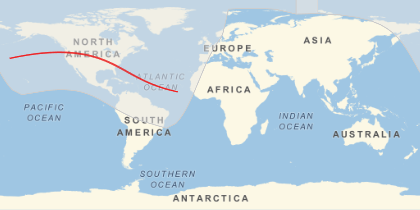
Now the red line is where there is total eclipse. So for any given moment in time it is a 'point'. Now 90% coverage (at the same moment) will be seen by all the people a 'circle' around that point, and the same for 80%, 70% ....10%....

So for any given moment in time during the eclipse you will have people with 100%, and the further you go away from that point the coverage decreases.

Now from your photos we have different times, and different coverages. So for each time we can find the center of the eclipses, and plot those circles with the different coverages. Where these intersect, there should be your location.

If I knew the exact orientation of your camera I would only need 1 photo.

It is by no means an easy calculation, but we can do many simplifications and maybe somethings comes out of it.

Cheers,

Sander!

POSTED BY: Sander Huisman

the red line is where there is total eclipse

I thought the region of total eclipse visibility is a polygon, according to these definitions:

  • "TotalPhaseCenterLine" - line representing the central path of the eclipse
  • "TotalPhasePolygon" - polygon representing the total phase of the eclipse

Am I wrong?

GeoGraphics[{GeoStyling[None],

  Opacity[.3], Orange, EdgeForm[Gray],
  SolarEclipse[DateObject[{2015, 1, 1, 0, 0}],
   "TotalPhasePolygon", EclipseType -> "Total"],

  Red, Thick,
  SolarEclipse[DateObject[{2015, 1, 1, 0, 0}],
   "TotalPhaseCenterLine", EclipseType -> "Total"]},

 ImageSize -> 800, GeoProjection -> "Orthographic",
 GeoZoomLevel -> 5]

enter image description here

POSTED BY: Vitaliy Kaurov

Indeed, the line is the central path. And the polygon is the area with 100% coverage. If you go outside that you will 90%, 80%, 70%. But note that these polygons is not for a single time, it is the 'sum' for the entire event. For a specific moment the 100% coverage will be something like a disk, and 90% a slightly larger disk, et cetera....

I'm pretty sure Wolfram has these algorithms in house to calculate these polygons. But, as of know, I don't think we have access to them...

POSTED BY: Sander Huisman

Vitaliy, can you post the Original full-resolution photos (as a zip?) so I can get the time-stamps, and a little bit more resolution on the images.

POSTED BY: Sander Huisman

Thanks Vitaliy, let me try some magic ;-)

POSTED BY: Sander Huisman

enter image description here -- you have earned Featured Contributor Badge enter image description here Your exceptional post has been selected for our editorial column Staff Picks http://wolfr.am/StaffPicks and Your Profile is now distinguished by a Featured Contributor Badge and is displayed on the Featured Contributor Board. Thank you!

POSTED BY: Moderation Team
Reply to this discussion
Community posts can be styled and formatted using the Markdown syntax.
Reply Preview
Attachments
Remove
or Discard

Group Abstract Group Abstract