Message Boards Message Boards

Aftermath of the solar eclipse

enter image description here

POSTED BY: Marco Thiel
16 Replies

Great Marco, excellent detective work ;) We know it was clear in Aberdeen on the eclipse day:

enter image description here

So I am curious - have you seen the eclipse - you must have had almost 100% sun coverage ? Also I am looking forward to doing a similar data digging when total solar eclipse will spam USA in 2017 - I just posted about the path of it (image below) - I hope folks in US will have similar devices that you featured.

enter image description here

POSTED BY: Vitaliy Kaurov

Hi Vitaliy,

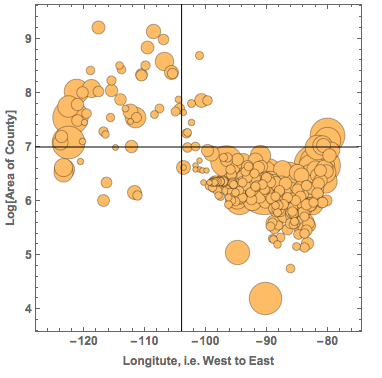
nice to hear from you. Yes I read your posts with great interest. The graphic you posted is really nice. It is very interesting to see the area of the different counties and how that depends on the GeoPosition, i.e. the further east the smaller. I found this instructive:

AbsoluteTiming[
 countydata = {CommonName[#], EntityValue[#, EntityProperty["AdministrativeDivision", "Area"]], 
                        EntityValue[#, EntityProperty["AdministrativeDivision", "Position"]], 
                        EntityValue[#, EntityProperty["AdministrativeDivision", "Population"]], 
                        EntityValue[#, EntityProperty["AdministrativeDivision", "PopulationDensity"]]} & /@ usco;] 

to get some data on the counties and then this BubbleChart:

BubbleChart[{Last@Flatten[List @@ #[[3]]], 
    Log@(QuantityMagnitude[#[[2]]]), QuantityMagnitude[#[[4]]]} & /@ countydata, 
 Epilog -> {Line[{{-104, 3.6}, {-104, 9.7}}], Line[{{-128, 7}, {-75, 7}}]}, FrameLabel -> {"Longitute, i.e. West to East", "Log[Area of County]"}, LabelStyle -> Directive[Bold, Medium]]
enter image description here

The x-axis is the position of the Counties from West to East. The y-axis shows the area of the counties and the size of the bubble represents the population in the County. The black lines are to guide the eye. The graph shows the large western Counties and the small eastern ones (in terms of surface/area). If we compare the counties east of -104 degrees longitude, we see that there are:

Total@(QuantityMagnitude@Select[countydata, Last@Flatten[List @@ #[[3]]] > -104 &][[All, 4]])
(*14755803*)

nearly 15 million people. In the west of -104 degrees, there are only

Total@(QuantityMagnitude@Select[countydata, Last@Flatten[List @@ #[[3]]] < -104 &][[All, 4]])
(*2228140*)

2.2 million people. So if the pleasure of experiencing such an event is roughly proportional to the number of people, there will be much more pleasure in the east. In other words the joy will increase over time...

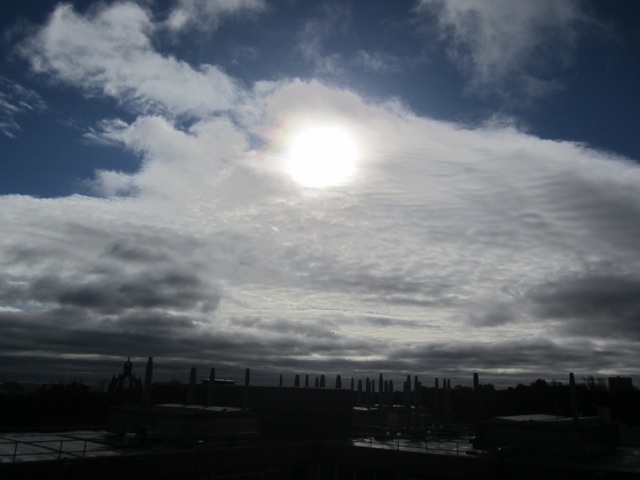
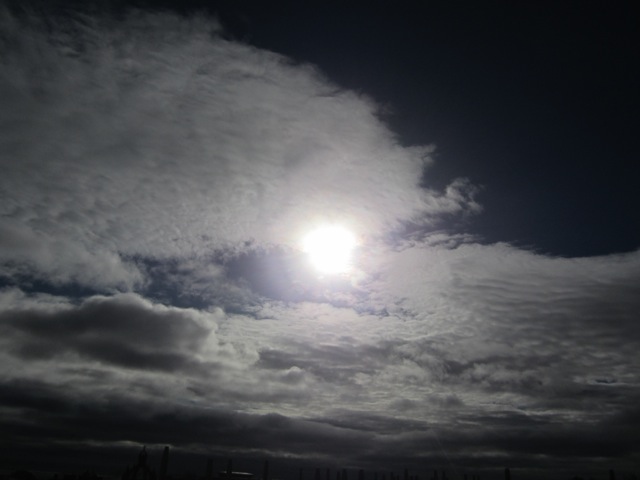
Sorry for this digression. Yes, Aberdeen was quite close to the zone of totality on 20 March. Unfortunately, the sky was not as clear as the station at the airport (a bit outside of Aberdeen) suggests. I was teaching/preparing to teach at the time, but here are some pictures that a colleague of mine took:
enter image description here

and

enter image description here

Even image processing cannot get those pictures clear. I have, however, seen some photos that students took that showed more. I will ask them to post some of the photos.

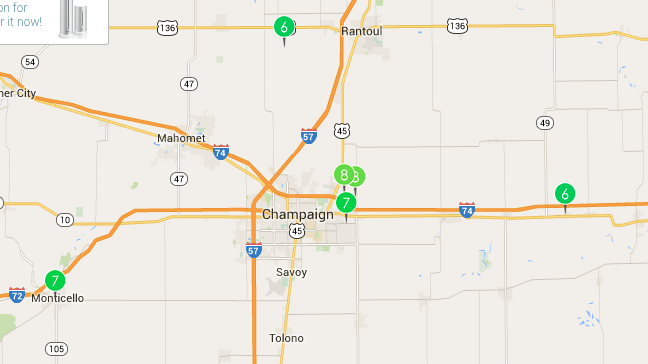
You also said that you hope that people in the US then will have the Netatmo devices. In fact, there are lots of them everywhere in the US. Here are the ones for Champaign IL:
enter image description here

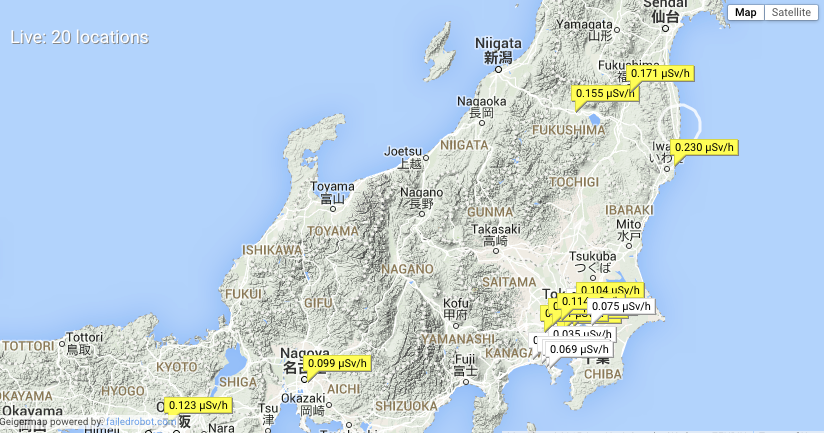
This is the cool stuff about these crowed-sourced devices. They are everywhere and the data can be quite cool. Here is a project in Japan where they use Geiger counters everywhere to track radioactivity levels:
enter image description here

It appears that one of the advantages of Mathematica is that, because of its ability to import all sorts of data, it can help to combine different publicly available data sources even if the data comes in very different forms. This is a nice step towards Conrad Wolfram's idea of How Citizen Computing Changes Democracy.

Data is everywhere and it's fun to work with it. With all the connected devices and technologies such as DataDrop the amount of data that will be collected in the future will be enormous. I am sure that in 2017 we will see great data collected during the eclipse.

For those who are already looking forward to it, here are some more impressions from this year's eclipse.

Cheers,

Marco

POSTED BY: Marco Thiel

Marco, thank you for such extended reply! Do you think the types of data you were mining here have significance for the global warming discussion? Have you or your team ever done research in that direction?

POSTED BY: Vitaliy Kaurov

Thanks you for a very interesting analysis, professor Thiel. Here are a few pictures of the eclipse from Aberdeen, around 9:25 am. enter image description here

enter image description here

POSTED BY: Tanvi Chheda

Hi Tanvi and Vitaliy,

I know that this does not work quite well yet, but if I take the photo that Tanvi posted

img = Import["~/Desktop/Eclipse.jpg"]

and crop it a bit:

img2 = ImageTrim[img, {{447.386`, 409.278`}, {513.381`, 344.818`}}]

I get:

enter image description here

The question that also relates to Sander's question in Vitaliy's post is: how much of the sun was covered. The idea is to cover the crescent by a disk:

MorphologicalComponents[Binarize[img2, 0.4], Method -> "BoundingDisk"] // Colorize

enter image description here

then determine the shape of the crescent itself:

MorphologicalComponents[Binarize[img2, 0.4]] // Colorize

enter image description here

and then calculate the respective areas:

full = ComponentMeasurements[MorphologicalComponents[Binarize[img2, 0.4], Method -> "BoundingDisk"], "Area"][[1, 2]]
(*1206.5*)
crescent = ComponentMeasurements[MorphologicalComponents[Binarize[img2, 0.4]] // Colorize, "Area"][[1, 2]]
(*311.75*)

The ratio of which is:

crescent/full

This gives a covering of about $74\%$. This number is only a rough estimate. The fitted disk is not quite right as you can see in this plot:

ImageMultiply[img2, ColorNegate@(MorphologicalPerimeter[MorphologicalComponents[Binarize[img2, 0.4], Method -> "BoundingDisk"], 0.2] // Colorize)]

enter image description here

The black circle is the estimate of the shape of the full sun, which is obviously not quite what we want.

Cheers,

M.

PS: Tanvi, thanks a lot for posting the photos!

POSTED BY: Marco Thiel

Hi Vitaliy,

i guess it might become important for the global warming discussion one day. The good thing is that there is very good data coverage in some areas. I think two of the main problems are: (i) there is basically no data at the arctic and antarctic; these regions are very important for climate models. Of course you can use Mathematica to do eg. Kriging to estimate the temperatures in these remote regions - or use additional satellite data. (ii) climate change is a rather long term process. It is not weather change, but is supposed to take place over long periods of time. So these private weather stations would have to be operational for many years, much longer than the product exists.

In principle it should be possible to monitor (data mine with the help of DataDrop?) some extreme weather events, e.g. pressure profiles during a Hurricane etc.

There is something else that might be interesting. It is way off the original topic of the post but it is meant as a side remark, so I'll just post it here. The people from Netatmo used the indoor sound measurements, which are not publicly available, to analyse the sound levels during the football/soccer world championships to find out which fans are most enthusiastic. This was actually a quite nice addition to the fantastic blog posts (first / second) on the Wolfram blog. All three studies use data one is from a crowed sourced database.

For my own data at home I can do something similar:

data = SemanticImport["~/Desktop/Indoor_25_3_2015.csv"];

enter image description here

If you now plot the noise levels (column6) you get

DateListPlot[Transpose[{Lookup[data // Normal, "column2"][[23 ;;]], MovingAverage[Lookup[data // Normal, "column6"][[4 ;;]], 20] // N}], FrameLabel -> {"Time", "Noise level dB"}, LabelStyle -> Directive[Bold, Medium]]

enter image description here

This is the noise level at my home. You see that something changed at the end of August last year, which was when my daughter was born. Before Christmas, when the noise level went down because we travelled, the noise levels went up; this agrees with her getting unsettled before Christmas. After coming back from the Christmas holidays we came back and left for another week or so as you can clearly see from the data. It is actually quite interesting to see that there is an interesting pattern developing towards the end of the time series.

DateListPlot[Transpose[{Lookup[data // Normal, "column2"][[23 ;;]], 
    MovingAverage[Lookup[data // Normal, "column6"][[4 ;;]], 20] // N}][[-500 ;;]], FrameLabel -> {"Time", "Noise level dB"}, LabelStyle -> Directive[Bold, Medium], AspectRatio -> 1/3,Filling-> Bottom]

enter image description here

The high frequency component corresponds to days, i.e. there is a daily cycle of the noise levels. Interestingly, there is also a longer 10-11 day cycle. I have absolutely no idea where that comes from. Any hints are welcome!

Cheers,

Marco

POSTED BY: Marco Thiel

Tanvi, thank you for posting! Did you or someone you know took these photos? If yes, do you happen to know with what camera and whether the photos were post-processed?

POSTED BY: Vitaliy Kaurov

Hi Marco,

inspired by your and Sander's posts on how much the sun was covered during the last eclipse, I also tried to write an evaluation from picture data. For this I use Tanvi's first picture (@Tanvi: Thanks for posting!), because in the second one the sun seem to be "cut" a bit at the edges by clouds. My ansatz is to use a model of the eclipse consisting of two equal sized disks overlapping each other. This simple model has five parameters (the number on the right side represents a fitness of match):

enter image description here

One can define a "fitness function" to quantify the goodness of match and try an optimization for this. Unfortunately I was not able to get that working perfectly - the result of NMaximize is not bad but by no means perfect. This seems strange because it is very easy to improve the solution by hand.

Once a result is obtained, e.g.:

enter image description here

one can very easy calculate the covering:

\[ScriptCapitalR] =  RegionDifference[Disk[{x, y}, r], Disk[{x + dr Cos[\[Phi]], y + dr Sin[\[Phi]]}, r]] /. opt;
Print["covering: ", 100 (1 - RegionMeasure[\[ScriptCapitalR]]/(Pi r^2) /. opt), "%"]

Otherwise I would not have a quick idea on how to do that - probably some ugly integrals ...

I have attached the notebook with the code. The next solar eclipse may come!

Henrik

Attachments:
POSTED BY: Henrik Schachner

Thanks Dr. Kaurov, I took the photos on an iPad, there's no processing done on the pictures.

POSTED BY: Tanvi Chheda

To highlight the diversity of the discussion we can use new in Wolfram Language function WordCloud:

post = Import["http://community.wolfram.com/groups/-/m/t/463721"];
Row[{
  WordCloud[ToUpperCase[DeleteStopwords[post]],
   ColorFunction -> "RustTones", Background -> Black, 
   ScalingFunctions -> (#^.1 &)],
  WordCloud[ToUpperCase[DeleteStopwords[post]],
   ColorFunction -> "RedBlueTones", ScalingFunctions -> (#^.1 &),
   Background -> ColorData["RedBlueTones"][0], 
   WordOrientation -> {{0, \[Pi]/2}}]}]

enter image description here

In the code above there are three handy tricks. First is that option WordOrientation has diverse settings for words' directions. Second is that a good choice ScalingFunctions can grant a good visual a peal, and simple power low I've chosen is often more flexible than logarithmic one. The third trick is subtler. It is the choice of background color to be the "bottom" color of the used ColorFunction. Then not only sizes of the words stress their weights, but also fading out into the background.

POSTED BY: Vitaliy Kaurov

Hi Vitaliy,

I have just seen that it won't take much before MMA10 arrives. Cannot wait to try stuff out. I have recently programmed a little miner for twitter. It would be nice to see how the WordCloud does in combination with that.

Cheers,

M.

POSTED BY: Marco Thiel

Dear Henrik,

that looks really great. I was aware that my method was quite flawed. I only cover he crescent with a disk which is by no means ideal. I hoped to be able to use a bit of maths to correct for that. Your Manipulate GUI is really nice! Thanks for sharing.

Best wishes,

M.

POSTED BY: Marco Thiel

This related discussion seems very interesting to me: Solar eclipses on other planets

POSTED BY: Vitaliy Kaurov

I mention all of you and your ideas in this blog: Solar Eclipses from Past to Future, Earth to Jupiter. Thanks for wonderful contributions and fun!

POSTED BY: Vitaliy Kaurov

enter image description here -- you have earned Featured Contributor Badge enter image description here Your exceptional post has been selected for our editorial column Staff Picks http://wolfr.am/StaffPicks and Your Profile is now distinguished by a Featured Contributor Badge and is displayed on the Featured Contributor Board. Thank you!

POSTED BY: EDITORIAL BOARD

For anyone looking for more resources ahead of the April 8, 2024, eclipse (especially Wolfram Language resources for computing and analyzing eclipses), check out Stephen Wolfram's new book "Predicting the Eclipse: A Multimillennium Tale of Computation". You get a copy on Amazon: https://www.amazon.com/Predicting-Eclipse-Multimillennium-Tale-Computation/dp/1579550878

POSTED BY: Paige Vigliarolo
Reply to this discussion
Community posts can be styled and formatted using the Markdown syntax.
Reply Preview
Attachments
Remove
or Discard

Group Abstract Group Abstract