I figured out a way to to plot the probability of good visibility of the solar eclipse. Define a function that can get the data for cloudiness over a large time span 2000 - 2015 taking US county name or a geo location as an argument:
ccd[c_] := WeatherData[c, "CloudCoverFraction", {{2000, 1, 1}, {2015, 1, 1}, All}]
I run it over all county names and fine the mean value:
seccd = ParallelMap[ccd, usco];
ccm[ts_] := Mean[DeleteMissing[Normal[ts], 1, Infinity][[All, 2]]];
avcc = ParallelMap[ccm, seccd] /. {_Mean -> .5, 0 -> .5};
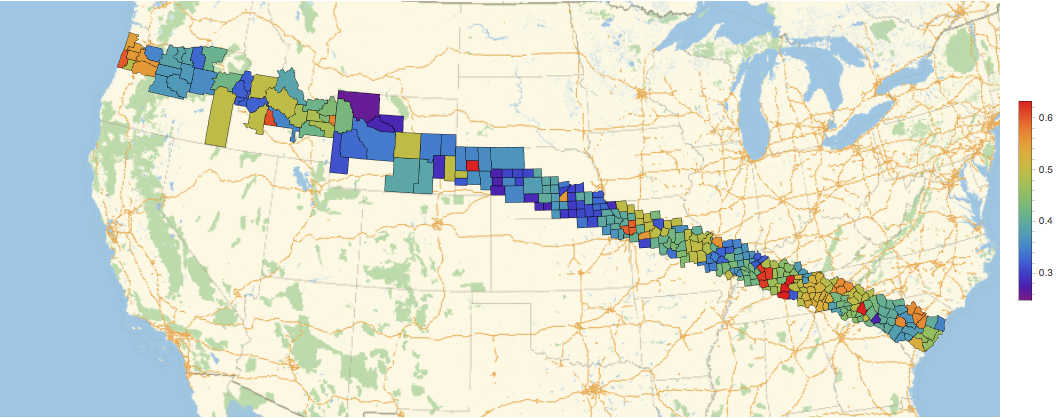
Note DeleteMissing needed due to not reliable weather station services. When we did not have any data for a county we substituted 0.5 value for the average, - I bet there are better ways of estimation. Now we again use the same technique:
GeoRegionValuePlot[Thread[usco -> avcc], ColorFunction -> "Rainbow"]
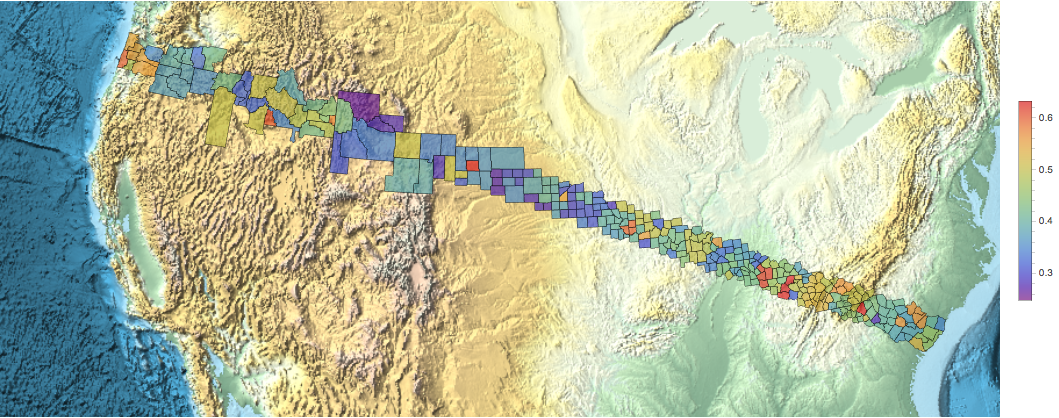
And here trying to see the influence of the Earth surface topology:
GeoRegionValuePlot[Thread[usco -> avcc],  ColorFunction -> "Rainbow",
GeoBackground -> "ReliefMap",  PlotStyle -> Opacity[.7]]