Hi there,
I downloaded all discrete distributions and tried to fit them nothing seemed to work well. Now with MMA 10.1 there is the new (experimental) function FindDistribution.
FindDistribution[data]
NegativeBinomialDistribution[2, 0.407108]
which seems to be the best guess. Unfortunately,
DistributionFitTest[data, NegativeBinomialDistribution[2, 0.40710823909531507`], "ShortTestConclusion"]
(*"Reject"*)
it does not survive the hypothesis test. You can, of course, use the empirical distribution, which is closely related to the histogram.
dist = EmpiricalDistribution[data];
PDF[dist, x]
(*19/124 Boole[0 == x] + 4/31 Boole[1 == x] + 51/124 Boole[2 == x] +
 9/124 Boole[3 == x] + 3/62 Boole[4 == x] + 5/124 Boole[5 == x] +
 1/31 Boole[6 == x] + 3/62 Boole[7 == x] + 1/62 Boole[8 == x] +
 1/124 Boole[9 == x] + 1/62 Boole[12 == x] + 1/124 Boole[13 == x] +
 1/62 Boole[15 == x]*)
If you evaluate that for the respective integers:
Table[PDF[dist, x], {x, 1, 15, 1}]
(*{4/31, 51/124, 9/124, 3/62, 5/124, 1/31, 3/62, 1/62, 1/124, 0, 0, 1/62, 1/124, 0, 1/62}*)
ListLinePlot[%, PlotRange -> All]
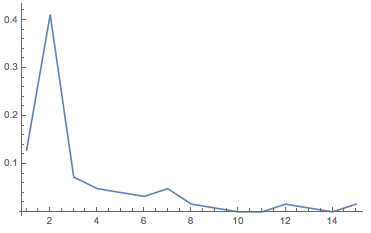
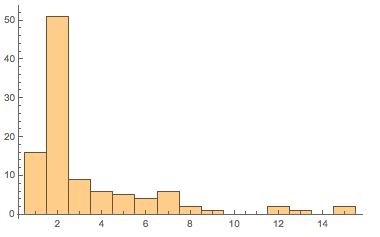
This is basically the normalised histogram:
Histogram[data, {0.5, 15.5, 1}]
Cheers,
M.


