As promised:
(*Get data*)
sunset = Sunset[Entity["City", {"NewHaven", "Connecticut", "UnitedStates"}], DateRange[{2015, 1, 1}, {2015, 12, 31}]];
sunrise = Sunrise[Entity["City", {"NewHaven", "Connecticut", "UnitedStates"}],DateRange[{2015, 1, 1}, {2015, 12, 31}]];
month = DateString[#, "MonthName"] & /@ DateRange[{2015, 1, 1}, {2015, 12, 31}];

(*Plot*)
listclean = 24. Mod[#, 1] & /@ QuantityMagnitude@(DateDifference[#[[1]], #[[2]]] & /@ Transpose[{DateString /@ sunrise["Values"],DateString /@ sunset["Values"]}]);
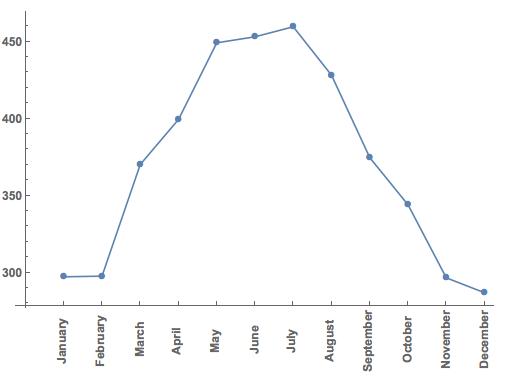
We can now get the total number of daylight hours by:
Total /@ GatherBy[Transpose[{month, listclean}], #[[1]] &][[All, All, 2]]
(*{297.233, 297.667, 370.167, 399.417, 449.15, 453.067, 459.567, 428.1, \
374.583, 343.983, 296.567, 286.883}*)
which give the following plot
ListLinePlot[Total /@ GatherBy[Transpose[{month, listclean}], #[[1]] &][[All, All,2]], PlotMarkers -> {Automatic, 10},
 Ticks -> {Transpose[{Range[12], Rotate[#, Pi/2] & /@ GatherBy[Tally@month, #[[1]] &][[All, 1, 1]]}], All},
 LabelStyle -> Directive[Bold, Medium]]

This is much faster, does not lead to time outs, so that the results are more reliable and it probably eats up fewer of your cloud credits/API requests.
Cheers,
M.
PS: Note that the Rotate command does not work in the cloud. The rest works just fine. This here should work though:
ListLinePlot[Total /@ GatherBy[Transpose[{month, listclean}], #[[1]] &][[All, All,2]], PlotMarkers -> {Automatic, 10},
Ticks -> {Transpose[{Range[12],DateString[#, "MonthNameShort"] & /@GatherBy[Tally@month, #[[1]] &][[All, 1, 1]]}], All},
LabelStyle -> Directive[Bold, Medium], ImageSize -> Large]