Message Boards Message Boards

0
|
12685 Views
|
3 Replies
|
0 Total Likes
View groups...
Share
Share this post:

How to get chart of daylight hours?

Posted 9 years ago

Hello all,

I'm new at using the Wolfram Alpha site, and am hoping to use it for some data about solar power. I was hoping it could give me a table of daylight hours per month via "total daylight hours per month in New Haven, Connecticut for 2014," but my various attempts at wording have not given me anything closer than today's daylight hours in New York City! Wolfram seems to focus on one part of the query or another, eg. only showing me the "day night terminator" or only showing me info about my town, and not combining the elements together.

I feel like I'm missing something simple, any tips will be much appreciated.

thanks!

POSTED BY: Yary H
3 Replies

As promised:

(*Get data*)
sunset = Sunset[Entity["City", {"NewHaven", "Connecticut", "UnitedStates"}], DateRange[{2015, 1, 1}, {2015, 12, 31}]];
sunrise = Sunrise[Entity["City", {"NewHaven", "Connecticut", "UnitedStates"}],DateRange[{2015, 1, 1}, {2015, 12, 31}]];
month = DateString[#, "MonthName"] & /@ DateRange[{2015, 1, 1}, {2015, 12, 31}];

(*Plot*)
listclean = 24. Mod[#, 1] & /@ QuantityMagnitude@(DateDifference[#[[1]], #[[2]]] & /@ Transpose[{DateString /@ sunrise["Values"],DateString /@ sunset["Values"]}]);

We can now get the total number of daylight hours by:

Total /@ GatherBy[Transpose[{month, listclean}], #[[1]] &][[All, All, 2]]
(*{297.233, 297.667, 370.167, 399.417, 449.15, 453.067, 459.567, 428.1, \
374.583, 343.983, 296.567, 286.883}*)

which give the following plot

ListLinePlot[Total /@ GatherBy[Transpose[{month, listclean}], #[[1]] &][[All, All,2]], PlotMarkers -> {Automatic, 10}, 
 Ticks -> {Transpose[{Range[12], Rotate[#, Pi/2] & /@ GatherBy[Tally@month, #[[1]] &][[All, 1, 1]]}], All}, 
 LabelStyle -> Directive[Bold, Medium]]

enter image description here

This is much faster, does not lead to time outs, so that the results are more reliable and it probably eats up fewer of your cloud credits/API requests.

Cheers,

M.

PS: Note that the Rotate command does not work in the cloud. The rest works just fine. This here should work though:

ListLinePlot[Total /@ GatherBy[Transpose[{month, listclean}], #[[1]] &][[All, All,2]], PlotMarkers -> {Automatic, 10},
Ticks -> {Transpose[{Range[12],DateString[#, "MonthNameShort"] & /@GatherBy[Tally@month, #[[1]] &][[All, 1, 1]]}], All},
LabelStyle -> Directive[Bold, Medium], ImageSize -> Large]
POSTED BY: Marco Thiel

Ok, sorry, I noticed that computationally that is one of the stupidest things to do. I'll post a better (much faster) solution later.

Cheers, Marco

POSTED BY: Marco Thiel

Hi there,

I do not know how to do this in WolframAlpha, but if you get a free Wolfram Cloud account you might try this:

list = Table[{DateValue[DatePlus[DateObject[{2015, 1, 1}], k], "MonthName"], 
   Mod[#, 1] & /@ QuantityMagnitude[(Sunset[Entity["City", {"NewHaven", "Connecticut", "UnitedStates"}], 
        DatePlus[DateObject[{2015, 1, 1}], k]] - Sunrise[Entity["City", {"NewHaven", "Connecticut", "UnitedStates"}], 
        DatePlus[DateObject[{2015, 1, 1}], k]])]}, {k, 1, 365}];
listclean = Select[list, NumberQ[#[[2]]] &];

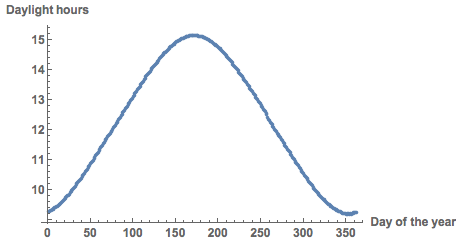
This gives you the daily data:

ListPlot[24.*Mod[#, 1] & /@ QuantityMagnitude[listclean[[All, 2]]], AxesLabel -> {"Day of the year", "Daylight hours"}, LabelStyle -> Directive[Bold, Medium]]

enter image description here

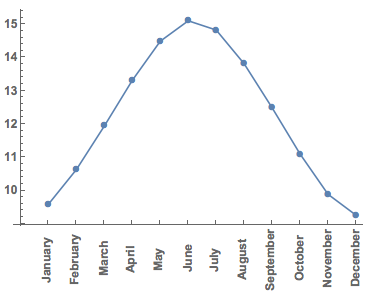
You can also get the average day light hours per month

daylength = Mean[Mod[#, 1] & /@ QuantityMagnitude[#[[All, 2]]]] & /@ GatherBy[listclean, #[[1]] &]

and then plot it:

ListLinePlot[24. daylength, PlotMarkers -> {Automatic, 10}, 
 Ticks -> {Transpose[{Range[12], Rotate[#, Pi/2] & /@ GatherBy[listclean, #[[1]] &][[All, 1, 1]]}], All}, LabelStyle -> Directive[Bold, Medium]]

enter image description here

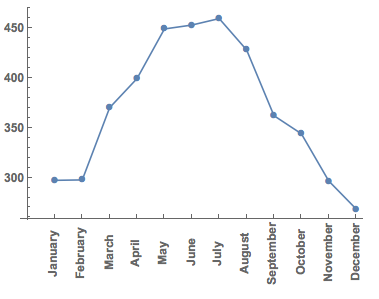
In principle you can now also calculate the total number of daylight hours per month:

Total /@ (24. Mod[#, 1] & /@ QuantityMagnitude[#[[All, 2]]] & /@ GatherBy[listclean, #[[1]] &])
(*{297.233, 297.667, 370.167, 399.417, 449.15, 453.067, 459.567, 428.1, \
362.1, 343.983, 296.567, 268.467}*)

The thing is that there were a couple of time outs when I downloaded the data, so that one day in September and two days in December were missing.

ListLinePlot[
 Total /@ (24. Mod[#, 1] & /@ QuantityMagnitude[#[[All, 2]]] & /@ 
    GatherBy[listclean, #[[1]] &]), PlotMarkers -> {Automatic, 10}, 
 Ticks -> {Transpose[{Range[12], Rotate[#, Pi/2] & /@ GatherBy[listclean, #[[1]] &][[All, 1, 1]]}], All}, LabelStyle -> Directive[Bold, Medium]]

enter image description here

Also it it easy to see that some months have fewer days than others.

Cheers,

M.

POSTED BY: Marco Thiel
Reply to this discussion
Community posts can be styled and formatted using the Markdown syntax.
Reply Preview
Attachments
Remove
or Discard

Group Abstract Group Abstract