Message Boards Message Boards

0
|
8185 Views
|
1 Reply
|
0 Total Likes
View groups...
Share
Share this post:

Trouble with VectorPlot function

Posted 9 years ago

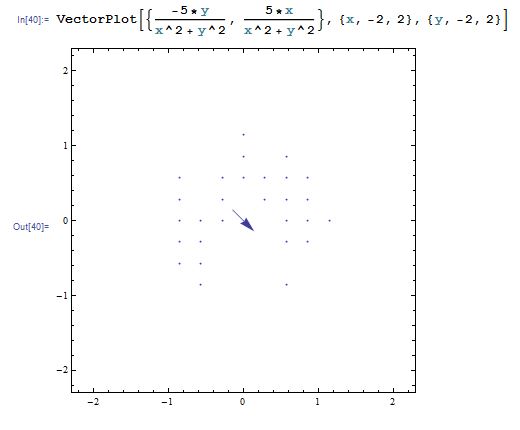
Good morning everyone. I am a newbie to the world of Mathematica. I'm a math tutor with a B.S. in electrical engineering, so the mathematics is not the problem. I have a calculus 3 student that is studying vector calculus. I'm having problems plotting using the VectorPlot script. When I type: VectorPlot[{-5y/(x^2+y^2),5x/(x^2+y^2)},{x,-2,2},{y,-2,2}], I get an incorrect graph (an x-y plane with a few dots on it, and a single vector). Vector Plot 2D, appears incorrect
If I change this to a 3D plot: VectorPlot3D[{-5y/(x^2+y^2),5x/(x^2+y^2),0},{x,-2,2},{y,-2,2},{z,-2,2}] then the graph is perfect except it is multiple layers.
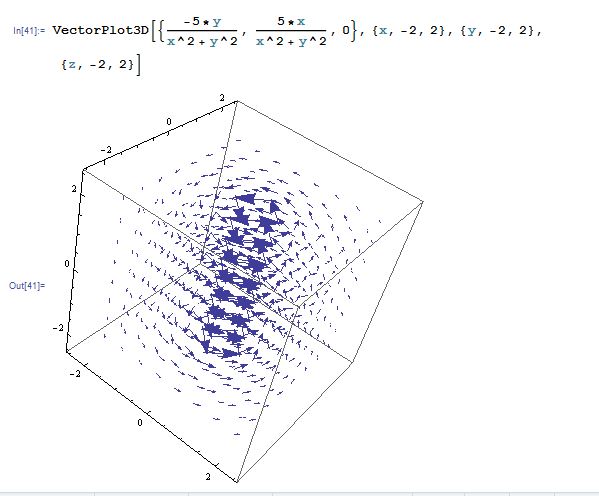
VectorPlot 3D front view

Obviously this 3D plot uses the z-magnitude of 0 so any single layer of this plot is exactly what the first 2D plot should look like.
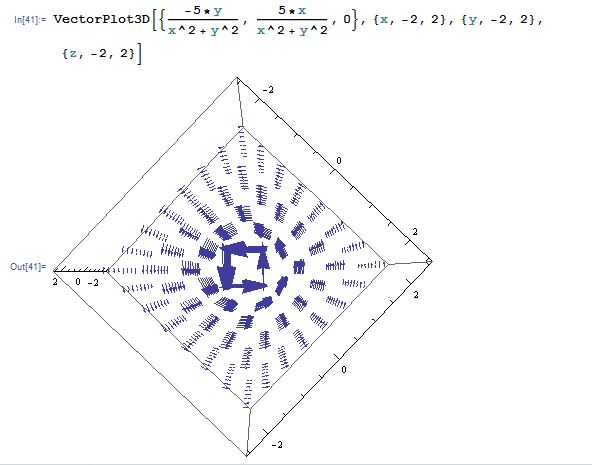
VectorPlot3D top view

I truly copied & pasted my VectorPlot function to be the VectorPlot3D function, and then added the z-magnitude. I can't figure out why the VectorPlot 2D isn't working correctly. Can any of you please offer your suggestions? Thank you! Bill Young Denver, CO

POSTED BY: Bill Young

Hi,

I think that this might be because of the way that Mathematica scale the vectors. The function drops off quickly as you move away from the origin. It appears that you might want to change the scaling manually using VectorScale:

VectorPlot[{-1. y/( x^2 + y^2), 1. x/( x^2 + y^2)}, {x, -2, 2}, {y, -2, 2}, VectorScale -> {0.1, 0.8, Automatic}]

enter image description here

or

VectorPlot[{-1. y/( x^2 + y^2), 1. x/( x^2 + y^2)}, {x, -2, 2}, {y, -2, 2}, VectorScale -> {0.1, 0.8, None}]

enter image description here

Cheers,

Marco

POSTED BY: Marco Thiel
Reply to this discussion
Community posts can be styled and formatted using the Markdown syntax.
Reply Preview
Attachments
Remove
or Discard

Group Abstract Group Abstract