Good morning everyone. I am a newbie to the world of Mathematica. I'm a math tutor with a B.S. in electrical engineering, so the mathematics is not the problem. I have a calculus 3 student that is studying vector calculus. I'm having problems plotting using the VectorPlot script. When I type: VectorPlot[{-5y/(x^2+y^2),5x/(x^2+y^2)},{x,-2,2},{y,-2,2}], I get an incorrect graph (an x-y plane with a few dots on it, and a single vector). 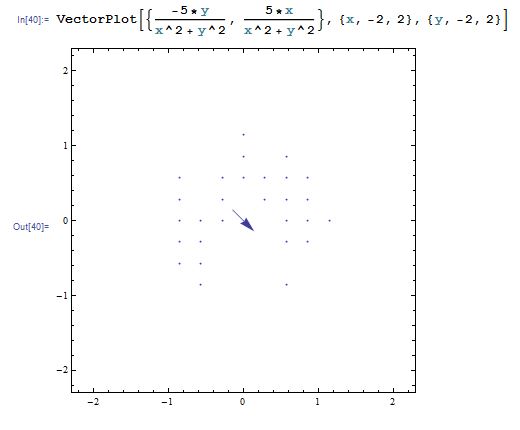
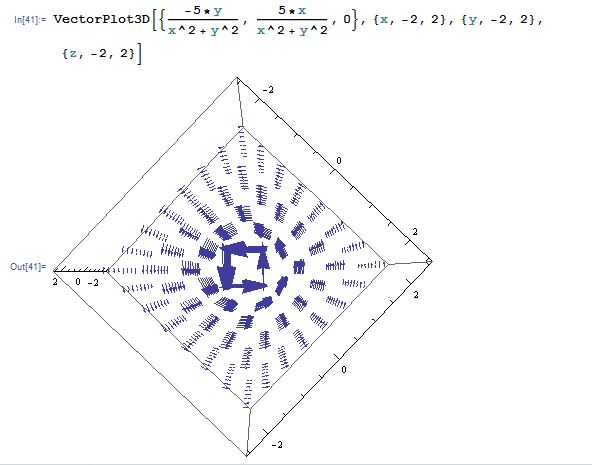
If I change this to a 3D plot: VectorPlot3D[{-5y/(x^2+y^2),5x/(x^2+y^2),0},{x,-2,2},{y,-2,2},{z,-2,2}] then the graph is perfect except it is multiple layers.
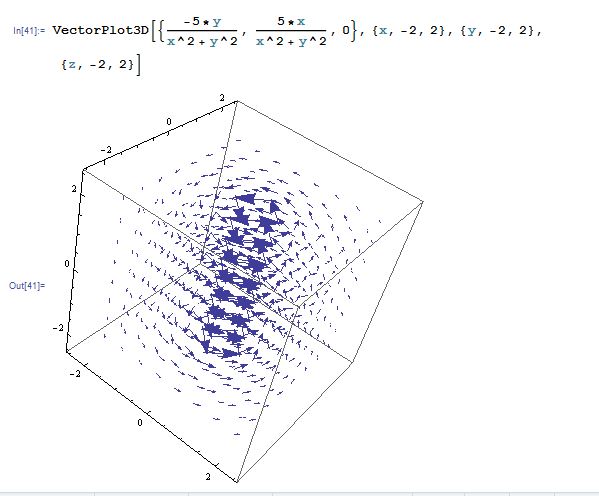
Obviously this 3D plot uses the z-magnitude of 0 so any single layer of this plot is exactly what the first 2D plot should look like.
I truly copied & pasted my VectorPlot function to be the VectorPlot3D function, and then added the z-magnitude. I can't figure out why the VectorPlot 2D isn't working correctly. Can any of you please offer your suggestions? Thank you! Bill Young Denver, CO


