Hi,
here is something to start with:
img = Import["~/Desktop/marker00.jpg"]
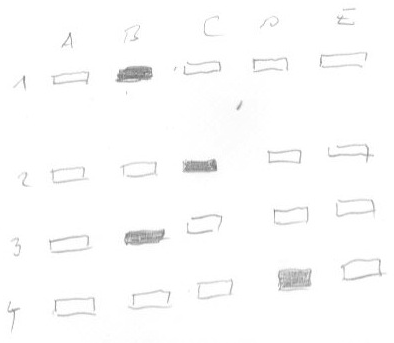
First we need a grid. If the boxes are more or less in the same position then we can create a template grid; I used the GetCoordinates tool:
coords = {{80.5`, 321.5`}, {78.5`, 260.0}, {79.5`, 182.5`}, {78.5`, 115.5`}, {80.5`, 51.5`}, {145.5`, 322.5`}, {214.5`, 322.5`}, {281.5`, 322.5`}, {350.5`, 324.5`}, {424.5`, 323.5`}};
Show[img, Graphics[Point /@ coords]]
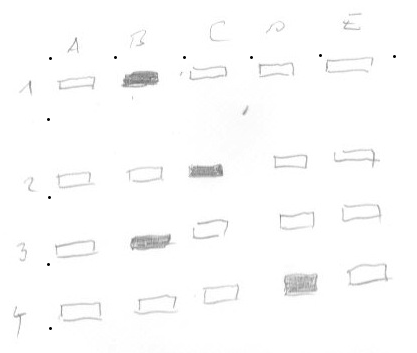
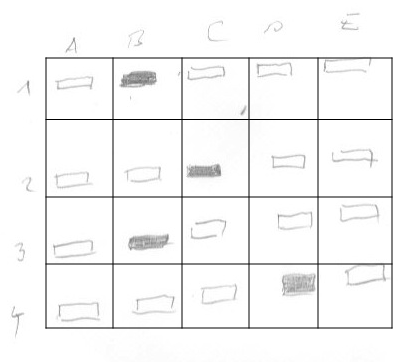
The dots mark my coordinates. This gives me a coordinate grid:
Show[img,
 Graphics@Line[{{Min[coords[[1 ;; 5]][[All, 1]]], #[[2]]}, {Max[
        coords[[6 ;;]][[All, 1]]], #[[2]]}}] & /@ coords[[1 ;; 5]],
 Graphics@Line[{{#, Min[coords[[1 ;; 5]][[All, 2]]]}, {#,
       Max[coords[[1 ;; 5]][[All, 2]]]}}] & /@
  Join[{Min[coords[[1 ;; 5]][[All, 1]]]}, coords[[6 ;;]][[All, 1]]]]
I can extract the relevant coordinate for the x- and y-axes:
xaxis = Reverse@Join[{Min[coords[[1 ;; 5]][[All, 1]]]}, coords[[6 ;;]][[All, 1]]];
yaxis = Reverse@coords[[1 ;; 5]][[All, 2]];
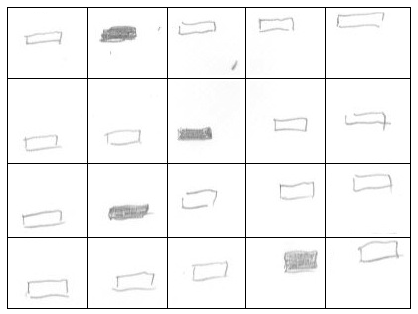
which I can then use to cut the respective fields out. To get a clearer representation I plot them in a grid:
Grid[ArrayReshape[
  ImageTrim[img, #] & /@
   Reverse@Flatten[
     Table[{{xaxis[[i + 1]], yaxis[[j + 1]]}, {xaxis[[i]],
        yaxis[[j]]}}, {j, 1, Length[yaxis] - 1}, {i, 1,
       Length[xaxis] - 1}], 1], {4, 5}], Frame -> All]
Next, we binaries:
Grid[ArrayReshape[
  Binarize /@ (ImageTrim[img, #] & /@
     Reverse@Flatten[
       Table[{{xaxis[[i + 1]], yaxis[[j + 1]]}, {xaxis[[i]],
          yaxis[[j]]}}, {j, 1, Length[yaxis] - 1}, {i, 1,
         Length[xaxis] - 1}], 1]), {4, 5}], Frame -> All]
and count the pixels:
graydata =
 ArrayReshape[
  Total[Flatten[
      ImageData[
       ColorNegate@#]]] & /@ (Binarize /@ (ImageTrim[img, #] & /@
       Reverse@Flatten[
         Table[{{xaxis[[i + 1]], yaxis[[j + 1]]}, {xaxis[[i]],
            yaxis[[j]]}}, {j, 1, Length[yaxis] - 1}, {i, 1,
           Length[xaxis] - 1}], 1])), {4, 5}];
We can plot this to check:
graydata // ArrayPlot
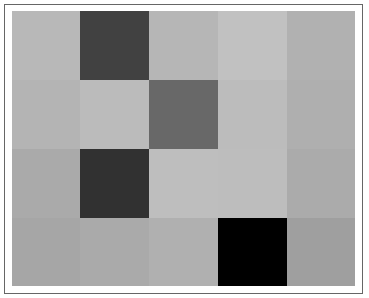
There are obviously two clusters:
clusts = FindClusters[Flatten[graydata], 2];
Which we can use to attach a "1" to "ticked" and a "0" to "unticked".
Flatten[Table[# -> 2. - i & /@ SortBy[clusts, Total][[i]], {i, 1, 2}]]
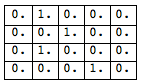
That gives us the matrix we want:
Grid[graydata /. Flatten[Table[# -> 2. - i & /@ SortBy[clusts, Total][[i]], {i, 1, 2}]], Frame -> All]
Note, that this describes the train of thought. We can wrap everything up into this nice and easily readable function:
tickedBoxes[img_Image] :=
 Module[{},
  coords = {{80.5`, 321.5`}, {78.5`, 260.0}, {79.5`, 182.5`}, {78.5`,
     115.5`}, {80.5`, 51.5`}, {145.5`, 322.5`}, {214.5`,
     322.5`}, {281.5`, 322.5`}, {350.5`, 324.5`}, {424.5`, 323.5`}};
  yaxis = Reverse@coords[[1 ;; 5]][[All, 2]];
  xaxis = Reverse@Join[{Min[coords[[1 ;; 5]][[All, 1]]]}, coords[[6 ;;]][[All, 1]]];
  graydata = ArrayReshape[Total[Flatten[ImageData[ColorNegate@#]]] & /@ (Binarize /@ (ImageTrim[img, #] & /@
         Reverse@Flatten[Table[{{xaxis[[i + 1]], yaxis[[j + 1]]}, {xaxis[[i]], yaxis[[j]]}}, {j, 1, Length[yaxis] - 1}, {i, 1, Length[xaxis] - 1}], 1])),{4, 5}];
  clusts = FindClusters[Flatten[graydata], 2];
  graydata /. Flatten[Table[# -> 2. - i & /@ SortBy[clusts, Total][[i]], {i, 1, 2}]]]
If you throw your image in it should work:
tickedBoxes[img]
(*{{0., 1., 0., 0., 0.}, {0., 0., 1., 0., 0.}, {0., 1., 0., 0., 0.}, {0., 0., 0., 1., 0.}}*)
There is a lot we can improve, but it should be a starting point.
Cheers,
Marco


