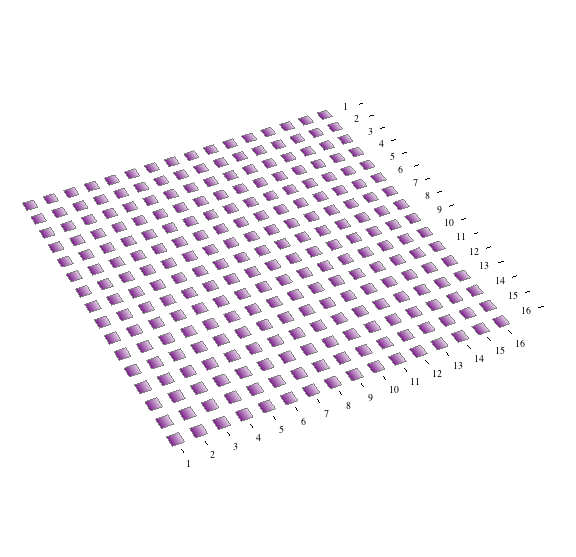
Hi guys, I have a problem that i'm not able to solve. I'm plotting a BarChart3D with the following code, and the result is the first image: I'd like to remove the black ticks but i need the numbers, and I can't find a way to remove just those without erase the numbers too..
BarChart3D[ConstantArray[0.00001, {16, 16}],
 ChartLayout -> "Grid",
 Boxed -> False,
 Method -> {"Canvas" -> None},
 FaceGrids -> None,
 AxesOrigin -> {30.5, 32.5, 0}, Axes -> {Automatic, Automatic, None},
 AxesStyle -> {White, White, None},
 ChartStyle -> "AvocadoColors",
 ColorFunction -> Function[{height}, ColorData["Rainbow"][height]],
 PlotRange -> {-0.5, 0.5},
 BarSpacing -> {0.9, 0.9},
 Ticks -> {{{0.5, "1 "}, {2.4, "2 "}, {4.3, "3"}, {6.2, "4"}, {8.1,
     "5"}, {10, "6 "}, {11.9, "7"}, {13.8, "8"}, {15.7, "9"}, {17.6,
     "10"}, {19.5, "11"}, {21.4, "12"}, {23.3, "13 "}, {25.2,
     "14"}, {27.1, "15"}, {29, "16"}}, {{0.5, "1 "}, {2.4,
     "2 "}, {4.3, "3"}, {6.2, "4"}, {8.1, "5"}, {10, "6 "}, {11.9,
     "7"}, {13.8, "8"}, {15.7, "9"}, {17.6, "10"}, {19.5,
     "11"}, {21.4, "12"}, {23.3, "13 "}, {25.2, "14"}, {27.1,
     "15"}, {29, "16"}}, None},
 TicksStyle -> {Black, Black, White},
 ViewPoint -> {3, -1.5, 3},
 ImageSize -> Large
 ]
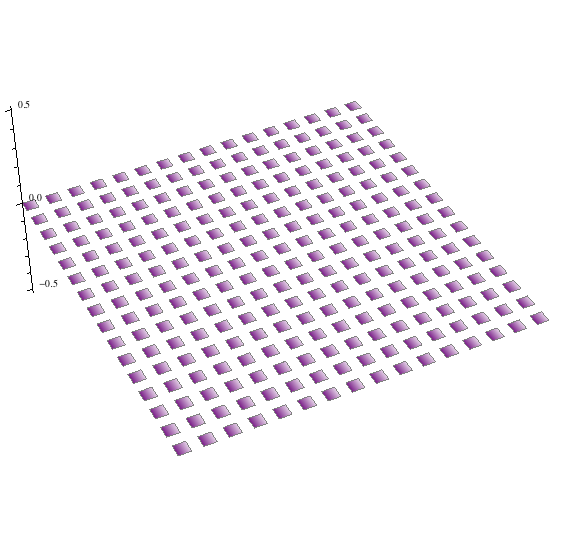
Another problem i that I'd like to put a z axis in the position of the second image (I've done it changing the code as follows)
 AxesOrigin -> {0, 0, 0}, Axes -> {None, None, Automatic},
 AxesStyle -> {None, White, Black},
 TicksStyle -> {None, None, Black},
But to do that, I should move even the numbers because i'm changing even the x and y axes: is there any way to put the z axis in {0,0,0} and the other to axes in another origin (as {30.5, 32.5, 0})?
Thank you all!


