If the data represent histogram information, then the raw data (if available) could be used to construct a nonparametric density estimate if a good description of the shape is adequate (as opposed to a need to interpret parameters in say a more parametric mixture distribution). Alternatively because there is so much data the raw data can be approximated by using the histogram bin values and the frequency counts:
(* Histogram information *)
data = {{3400.5, 16}, {3401.5, 32}, {3402.5, 24}, {3403.5,
28}, {3404.5, 21}, {3405.5, 25}, {3406.5, 24}, {3407.5,
28}, {3408.5, 34}, {3409.5, 28}, {3410.5, 26}, {3411.5,
38}, {3412.5, 26}, {3413.5, 30}, {3414.5, 41}, {3415.5,
44}, {3416.5, 30}, {3417.5, 34}, {3418.5, 50}, {3419.5,
55}, {3420.5, 48}, {3421.5, 60}, {3422.5, 66}, {3423.5,
59}, {3424.5, 81}, {3425.5, 73}, {3426.5, 77}, {3427.5,
61}, {3428.5, 89}, {3429.5, 92}, {3430.5, 74}, {3431.5,
97}, {3432.5, 99}, {3433.5, 107}, {3434.5, 104}, {3435.5,
104}, {3436.5, 107}, {3437.5, 140}, {3438.5, 129}, {3439.5,
120}, {3440.5, 143}, {3441.5, 158}, {3442.5, 148}, {3443.5,
143}, {3444.5, 184}, {3445.5, 191}, {3446.5, 185}, {3447.5,
189}, {3448.5, 208}, {3449.5, 227}, {3450.5, 231}, {3451.5,
244}, {3452.5, 261}, {3453.5, 268}, {3454.5, 302}, {3455.5,
306}, {3456.5, 332}, {3457.5, 337}, {3458.5, 357}, {3459.5,
347}, {3460.5, 347}, {3461.5, 401}, {3462.5, 396}, {3463.5,
432}, {3464.5, 422}, {3465.5, 428}, {3466.5, 469}, {3467.5,
472}, {3468.5, 451}, {3469.5, 456}, {3470.5, 449}, {3471.5,
477}, {3472.5, 509}, {3473.5, 513}, {3474.5, 482}, {3475.5,
480}, {3476.5, 500}, {3477.5, 508}, {3478.5, 522}, {3479.5,
519}, {3480.5, 550}, {3481.5, 576}, {3482.5, 590}, {3483.5,
628}, {3484.5, 646}, {3485.5, 709}, {3486.5, 700}, {3487.5,
706}, {3488.5, 732}, {3489.5, 683}, {3490.5, 732}, {3491.5,
711}, {3492.5, 697}, {3493.5, 603}, {3494.5, 657}, {3495.5,
571}, {3496.5, 526}, {3497.5, 470}, {3498.5, 427}, {3499.5,
358}, {3500.5, 339}, {3501.5, 307}, {3502.5, 251}, {3503.5,
201}, {3504.5, 147}, {3505.5, 139}, {3506.5, 122}, {3507.5,
95}, {3508.5, 51}, {3509.5, 66}, {3510.5, 39}, {3511.5,
37}, {3512.5, 29}, {3513.5, 18}, {3514.5, 19}, {3515.5,
13}, {3516.5, 5}, {3517.5, 4}, {3518.5, 8}, {3519.5, 8}, {3520.5,
1}};
(* "Reconstruct" raw data *)
rawData = Table[0, {i, Total[data[[All, 2]]]}];
n = 0;
Do[Do[n = n + 1; rawData[[n]] = data[[i, 1]], {j, data[[i, 2]]}], {i,
Length[data[[All, 1]]]}]
(* Construct nonparametric density estimate *)
f = SmoothKernelDistribution[rawData];
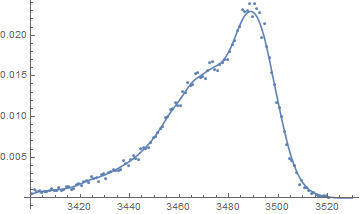
(* Plot relative frequencies and nonparametric density estimate *)
Show[{
Plot[PDF[f, x], {x, 3400, 3530}],
ListPlot[
Table[{data[[i, 1]], data[[i, 2]]/n}, {i, Length[data[[All, 1]]]}]]
}]