Message Boards Message Boards

0
|
11345 Views
|
8 Replies
|
4 Total Likes
View groups...
Share
Share this post:

Star Shape cartesian equation

Posted 9 years ago

I need Cartesian equation of the following star shape. As i want to use its Cartesian equation for Plot3D.enter image description here

POSTED BY: Kashif Nazar
8 Replies

Try with this syntax:

RegionFunction -> 
 Function[{x, y, z}, 
  1.2 + 0.4 Cos[4 ArcTan[x, y]] < Sqrt[x^2 + y^2] < 
    6 + 0.8 Cos[18 ArcTan[x, y]] && z <= 1]
POSTED BY: Gianluca Gorni

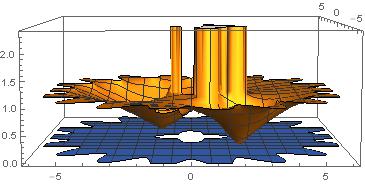
In my previous reply, i got the figure 1 from following codes (ffNoin is my function from my theory)

Gro[zz_] := ffNoin[zz]
Grp[x_, y_] := Gro[x + I y]
Plot3D[{Abs[Grp[x, y]], 0}, {x, -6, 6}, {y, -6, 6}, 
 RegionFunction -> 
  Function[{x, y, z}, 
   1.2 + 0.4 Cos[4 ArcTan[x, y]] < Sqrt[x^2 + y^2] < 
    6 + 0.8 Cos[18 ArcTan[x, y]]]]

enter image description here But if i also include z<=1, the i get the following

Gro[zz_] := ffNoin[zz]
Grp[x_, y_] := Gro[x + I y]
Plot3D[{Abs[Grp[x, y]], 0}, {x, -6, 6}, {y, -6, 6}, 
 RegionFunction -> 
  Function[{x, y, z}, 
   1.2 + 0.4 Cos[4 ArcTan[x, y]] < Sqrt[x^2 + y^2] < 
    6 + 0.8 Cos[18 ArcTan[x, y]], z <= 1]]

Attributes::attnf: z<=1 is not a known attribute. >>

Attributes::attnf: z<=1 is not a known attribute. >>

Plot3D::invregion: Function[{x,y,z},1.2 +0.4 Cos[4 ArcTan[x,y]]<Sqrt[x^2+y^2]<6+0.8 Cos[18 ArcTan[x,y]],z<=1] must be a Boolean function. >>

Plot3D::invregion: Function[{x,y,z},1.2 +0.4 Cos[4 ArcTan[x,y]]<Sqrt[x^2+y^2]<6+0.8 Cos[18 ArcTan[x,y]],z<=1] must be a Boolean function. >>

Attributes::attnf: z<=1 is not a known attribute. >>

General::stop: Further output of Attributes::attnf will be suppressed during this calculation. >>

Plot3D::invregion: Function[{x,y,z},1.2 +0.4 Cos[4 ArcTan[x,y]]<Sqrt[x^2+y^2]<6+0.8 Cos[18 ArcTan[x,y]],z<=1] must be a Boolean function. >>

General::stop: Further output of Plot3D::invregion will be suppressed during this calculation. >>

enter image description here

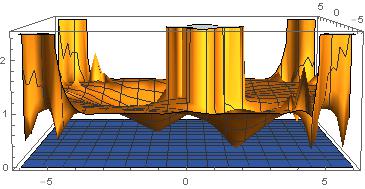
I need the bottom portion (in plane) same like in first figure and 3D portion to merge in the unit circle.

POSTED BY: Kashif Nazar

Have you tried giving the option

RegionFunction -> Function[{x, y, z}, z<=1]
POSTED BY: Gianluca Gorni

Helllo , I am really thankful to all members who responded my problem, and these suggestions really helped me and i have now the following 3D graph, I want to merge 3D graph in (figure1) below into unit circle ( as like in figure 2) but on plane i need the same curve as in the following first figure

Figure1 enter image description here
Figure2 enter image description here

POSTED BY: Kashif Nazar
Posted 9 years ago

Please note when you post the same question simultaneously to multiple sites: Mathematica.Stackexchange

POSTED BY: Jim Baldwin
Posted 9 years ago

And if you need a 3D shape you can proceed also as follows: Convert to cartesian using FromPolarCoordinates:

In[18]:= gear[\[Theta]_] := {1 + 
   1/8 Sin[18 (\[Theta] - \[Pi]/4)], \[Theta]}
FromPolarCoordinates[gear[\[Theta]]]
ParametricPlot[%, {\[Theta], 0, 2 \[Pi]}]

Out[19]= {Cos[\[Theta]] (1 + 1/8 Sin[18 (-(\[Pi]/4) + \[Theta])]), 
 Sin[\[Theta]] (1 + 1/8 Sin[18 (-(\[Pi]/4) + \[Theta])])}

parametric plot

Insert a 3rd dimension (eg in the y direction) and make a ParametricPlot3D:

In[30]:= Insert[FromPolarCoordinates[gear[\[Theta]]], y, 2]
ParametricPlot3D[%, {\[Theta], 0, 2 \[Pi]}, {y, 0, 1}, 
 PlotPoints -> 25, PlotTheme -> "Marketing",  
 PerformanceGoal -> "Quality"]

Out[30]= {Cos[\[Theta]] (1 + 1/8 Sin[18 (-(\[Pi]/4) + \[Theta])]), y, 
 Sin[\[Theta]] (1 + 1/8 Sin[18 (-(\[Pi]/4) + \[Theta])])}

parametric plot in 3D

POSTED BY: Erik Mahieu

Your plot looks like this:

ParametricPlot[6 (1 + 1/10 Cos[18 t]) {Cos[t], Sin[t]}, {t, 0, 2 Pi}]

The following function of x,y

func = z /. 
  First@Solve[
    TrigExpand[r == Sqrt[z]*6 (1 + 1/10 Cos[18 t])] /. {Cos[t] -> x/r,
        Sin[t] -> y/r} /. r -> Sqrt[x^2 + y^2], z]

has its z=1 slice that looks like your plot:

ContourPlot[Evaluate[func], {x, -6.6, 6.6}, {y, -6.6, 6.6}]
Plot3D[Evaluate[func], {x, y} \[Element] Disk[{0, 0}, 7], 
 MeshFunctions -> {#3 &}]
POSTED BY: Gianluca Gorni
Posted 9 years ago

I presume the polar equation of yr plot is:

r->1 + 1/8 Sin[18 \[Theta]
PolarPlot[(1 + 1/8 Sin[18 \[Theta]]), {\[Theta], 0, 2 \[Pi]}]

enter image description here

If you convert to Cartesian, you get ann intrinsic equation of the gear shape:

1 + 1/8 Sin[18 ArcTan[x, y]] == Sqrt[x^2 + y^2]
ContourPlot[
 1 + 1/8 Sin[18 ArcTan[x, y]] == Sqrt[x^2 + y^2], {x, -1.15, 
  1.15}, {y, -1.15, 1.15}, Axes -> True]

enter image description here

Can this be any help?: Plotting Extruded Profiles

POSTED BY: Erik Mahieu
Reply to this discussion
Community posts can be styled and formatted using the Markdown syntax.
Reply Preview
Attachments
Remove
or Discard

Group Abstract Group Abstract