Group Abstract Group Abstract

Message Boards Message Boards

Package for Radar Charts

Posted 10 years ago
POSTED BY: Diego Zviovich
13 Replies

enter image description here - another post of yours has been selected for the Staff Picks group, congratulations !

We are happy to see you at the top of the "Featured Contributor" board. Thank you for your wonderful contributions, and please keep them coming!

POSTED BY: EDITORIAL BOARD
POSTED BY: Vitaliy Kaurov

Few suggestions:

  • Filling from curve to curve like Filling -> {1 -> {2}}

  • AxesType -> "Star" should not remove circular gridlines

  • Mesh -> All and Joined->False for display by points

POSTED BY: Vitaliy Kaurov
Posted 10 years ago

Good points for the improvements, I'll take a look at the code to start adding the requested features.

POSTED BY: Diego Zviovich
Posted 10 years ago

Two out of three points addressed:

AxesType -> "Star" no longer removes circular gridlines

Mesh -> All and Joined->False for display by points enabled.

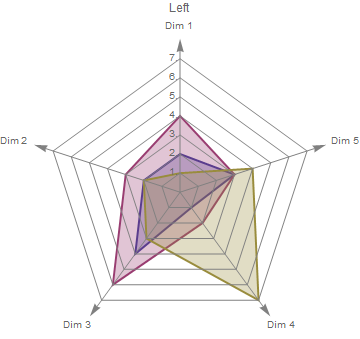
RadarChart[{{2, 2, 4, 1, 3}, {4, 3, 6, 2, 3}, {1, 2, 3, 7., 4}}, 
 ChartLegends -> None, PlotLabel -> "Left", AxesType -> "Star", 
 Filling -> Bottom]

enter image description here

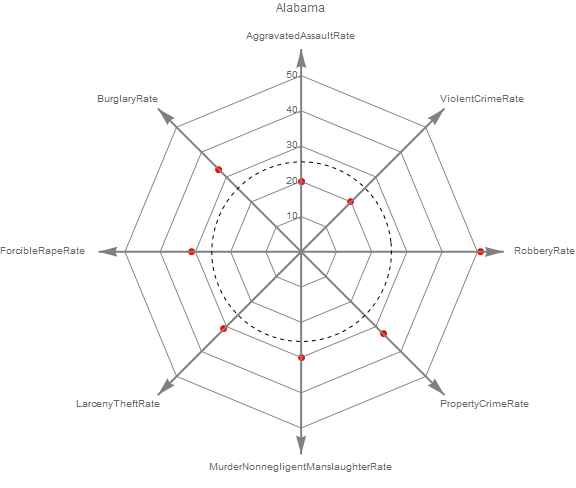
RadarChart[table[[1, 2 ;;]], AxesLabel -> Rest@prop, 
 ChartLegends -> None, AxesType -> "Star", PlotRange -> {0, 50}, 
 PlotLabel -> table[[1, 1]], ImageSize -> Large, Joined -> False, 
 PlotStyle -> {{Red, PointSize[Large]}}, 
 Epilog -> {Dashed, Circle[{0, 0}, 25.5]}]

enter image description here

POSTED BY: Diego Zviovich

Very nice, @Diego Zviovich, thank you !

POSTED BY: Vitaliy Kaurov

Merry Christmas and Happy Holidays!

RadarChart[{aux = Join[{10}, #, Reverse@#] &@{8, 8, 7, 8, 9, 2, 1, 1},
   Join[{0}, #, Reverse@#] &@{0, 0, 0, 0, 0, 0, 0, 10}}, 
 Filling -> Axis, PlotStyle -> {Green, Brown}, 
 Epilog -> {Red, PointSize[0.02], 
   Point[MapIndexed[
     FromPolarCoordinates@{N@#1, 
        bux = Mod[(First[N@#2] - 1)*2 Pi/Length[aux], 2 Pi] + Pi/2; 
        If[bux > Pi, bux - 2 Pi, bux]} &, 
     Join[aux, 0.7*aux, 0.4*aux]]]}, ChartLegends -> None, 
 AxesLabel -> None]

enter image description here

PS - why is PolarCoordinates limited between -Pi and Pi?

POSTED BY: Pedro Fonseca
Posted 10 years ago

Feliz Natal Pedro!

POSTED BY: Diego Zviovich

This is wonderful, Diego! Thank you very much for sharing (and documenting!) the RadarChart package.

POSTED BY: Bernat Espigulé
Posted 10 years ago

What a marvelous Christmas present. Thank you very much, Diego!

Kind regards, David

POSTED BY: David Keith
Posted 10 years ago

Thanks David!

POSTED BY: Diego Zviovich

@Diego Zviovich this is absolutely stunning, - both the package and the way you documented here its usage. Thank you for making such an exemplary post. I added it it also to Mathematica AddOns and Know-How groups. Are you the author of the package and owner of the linked GitHub repository? I also think we should take the skeleton markdown code for your wonderful doc-like post and make it available to everyone.

POSTED BY: Vitaliy Kaurov
Posted 10 years ago

Hi Vitaly,

Yes, I wrote the package as an exercise for learning to use the Mathematica workbench (very cool) and the Github Site.

Regarding the documentation and installer, I borrowed heavily from @Patrick Scheibe's github repository. so kudos to him for setting up such high standards.

POSTED BY: Diego Zviovich
Reply to this discussion
Community posts can be styled and formatted using the Markdown syntax.
Reply Preview
Attachments
Remove
or Discard