NOTE: interactive Wolfram Cloud app is HERE.
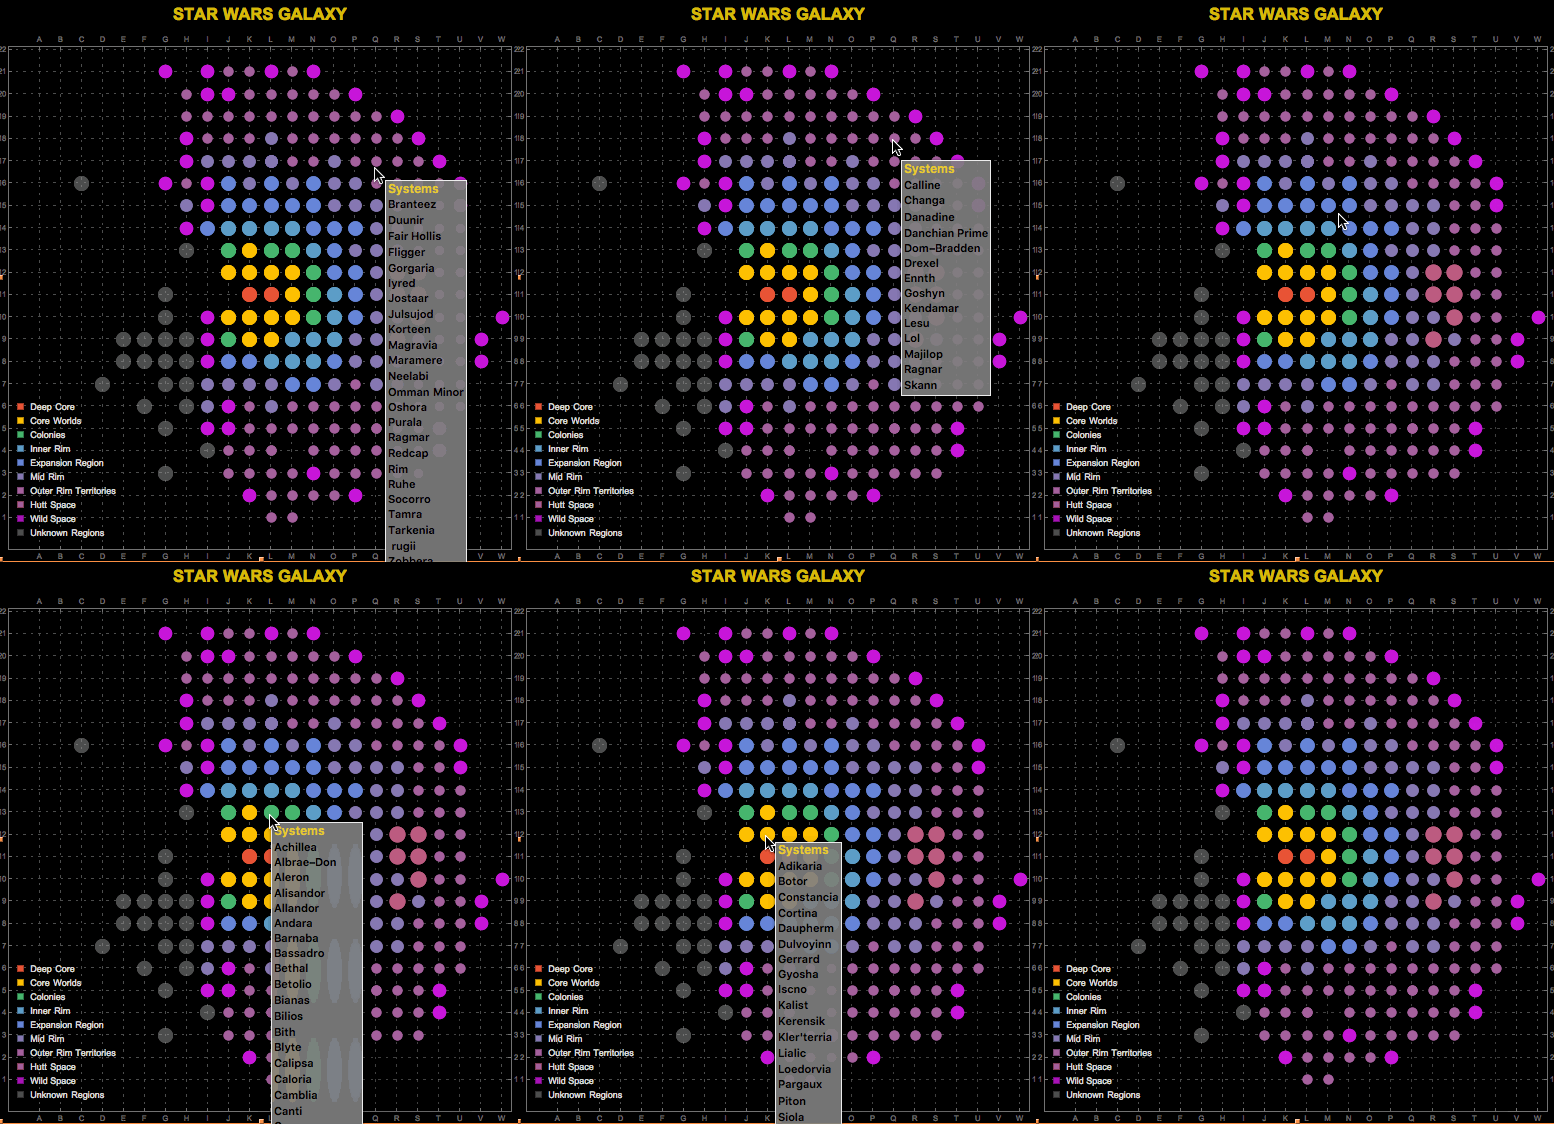
I will show how to make this visualization below:
STAR WARS ATLAS
Since The Force Awakens opening date the Star Wars galaxy has been part of our lives once again. Nevertheless, how much do we know about this galaxy?
To be honest, I didn't know much about it until I came across with the book: STAR WARS: THE ESSENTIAL ATLAS COMPANION .

Luckily apart of the printed version there is a massive online appendix of all known star systems in the Star Wars galaxy, available in a downloadable PDF document at the official Star Wars site.
I downloaded the pdf and I imported it into my notebook as a plain text:
pdf = Import["Starwars.com_Atlas_appendix_June_15.pdf", "Plaintext"]
The structure of the list is quite simple and with the Wolfram Language is easy to obtain the relevant data (star systems and regions names and their coordinates):
data = Select[
  Select[Select[#, ! # == "" &] & /@ (StringSplit[#, "  "] & /@ StringSplit[pdf, "\n"]),
   Length[#] == 3 \[Or]
     Length[#] == 4 &], ! #[[1]] == "SYSTEM" && ! #[[1]] ==
      "Copyright © 2015 by Lucas\.1flm Ltd. & ® or TM where \
indicated. All rights reserved." && ! #[[-2]] == "www.starwars.com/atlas" &]
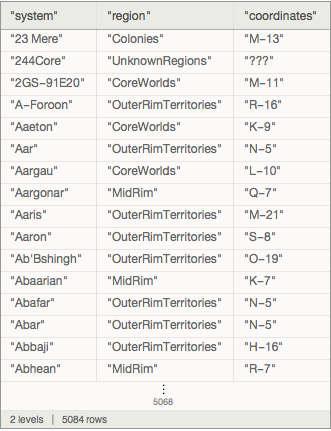
Now we can easily create a Dataset (a list of associations in this case) with more than 5000 systems:
swplanets = Dataset[<|"system" -> #[[1]],
     "region" -> StringJoin@StringSplit[#[[-2]], " "],
     "coordinates" -> Last[StringSplit[#[[-1]], " "]]|> & /@ data]
Finally with this Dataset in our hands we can represent the known regions of the Star Wars Galaxy with the following ListPlot:
ListPlot[Partition[{First @@ Position[CharacterRange["A", "Z"], #[[1]]], ToExpression[#[[2]]]} & /@
   Normal@swplanets[
     Select[! MemberQ[{"???", "186", "N/A"}, #coordinates] &],
     StringSplit[#coordinates, "-"] &], 1],
 PlotStyle ->
   Normal@swplanets[
     Select[! MemberQ[{"???", "186", "N/A"}, #coordinates] &], "region"] /.
  {"Colonies" -> {PointSize[0.03],
     RGBColor[0.28026441037696703`, 0.715, 0.4292089322474965]},
   "UnknownRegions" -> {PointSize[0.03],
     RGBColor[0.5, 0.5, 0.5, 0.5]},
   "CoreWorlds" -> {PointSize[0.03], RGBColor[1, 0.75, 0]},
   "OuterRimTerritories" -> {PointSize[0.02],
     RGBColor[0.647624, 0.37816, 0.614037]},
   "MidRim" -> {PointSize[0.025],
     RGBColor[0.528488, 0.470624, 0.701351]},
   "DeepCore" -> {PointSize[0.03], RGBColor[0.915, 0.3325, 0.2125]},
   "InnerRim" -> {PointSize[0.03],
     RGBColor[0.363898, 0.618501, 0.782349]},
   "ExpansionRegion" -> {PointSize[0.03],
     RGBColor[0.40082222609352647`, 0.5220066643438841, 0.85]},
   "WildSpace" -> {PointSize[0.027],
     RGBColor[0.8200000000000001, 0.09, 0.89, 0.81]},
   "HuttSpace" -> {PointSize[0.03],
     RGBColor[0.736782672705901, 0.358, 0.5030266573755369]},
   "[extragalactic]" -> {PointSize[0.015],
     RGBColor[0.560181, 0.691569, 0.194885]},
   " arin(KarstaxonRegions)OuterRimTerritories" -> {PointSize[0.03],
     RGBColor[1., 0.29, 0.45, 0.6900000000000001]},
   "Suolriep(IotranExpanse)OuterRimTerritories" -> {PointSize[0.03],
     RGBColor[0.8200000000000001, 0.29, 0.89, 0.6900000000000001]},
   "MidRm" -> {PointSize[0.03], RGBColor[0.571589, 0.586483, 0.]},
   "MidRim/OuterRimT." -> {PointSize[0.03],
     RGBColor[0.7000000000000001, 0.49, 0.98, 0.8200000000000001]}},
 AspectRatio -> 1, Frame -> True, GridLines -> {Range[26]},
 GridLinesStyle ->
  Directive[RGBColor[0.5, 0.5, 0.5, 0.5], Dashing[{0.005, 0.01}]],
 Background -> Black, ImageSize -> 600,
 FrameTicks -> {MapThread[
    List, {Range[26], CharacterRange["A", "Z"]}], Range[26]},
 PlotLegends ->
  Placed[SwatchLegend[
    {RGBColor[0.915, 0.3325, 0.2125],
     RGBColor[1, 0.75, 0],
     RGBColor[0.28026441037696703`, 0.715, 0.4292089322474965],
     RGBColor[0.363898, 0.618501, 0.782349],
     RGBColor[0.40082222609352647`, 0.5220066643438841, 0.85],
     RGBColor[0.528488, 0.470624, 0.701351],
     RGBColor[0.647624, 0.37816, 0.614037],
     RGBColor[0.736782672705901, 0.358, 0.5030266573755369],
     RGBColor[0.8200000000000001, 0.09, 0.89, 0.81],
     RGBColor[0.5, 0.5, 0.5, 0.5]},
  {"Deep Core", "Core Worlds",  "Colonies", "Inner Rim", "Expansion Region", "Mid Rim",
   "Outer Rim Territories", "Hutt Space", "Wild Space",  "Unknown Regions"},
 LabelStyle -> {LightGray, Medium}], {Left, Bottom}],
 PlotLabel -> Style[Framed["STAR WARS GALAXY", FrameMargins -> 10,
 FrameStyle -> Transparent], 22, RGBColor[1, 0.86, 0, 0.85], Bold]]
Note that the result has a strange shape because the left area of the galaxy is mainly unknown:
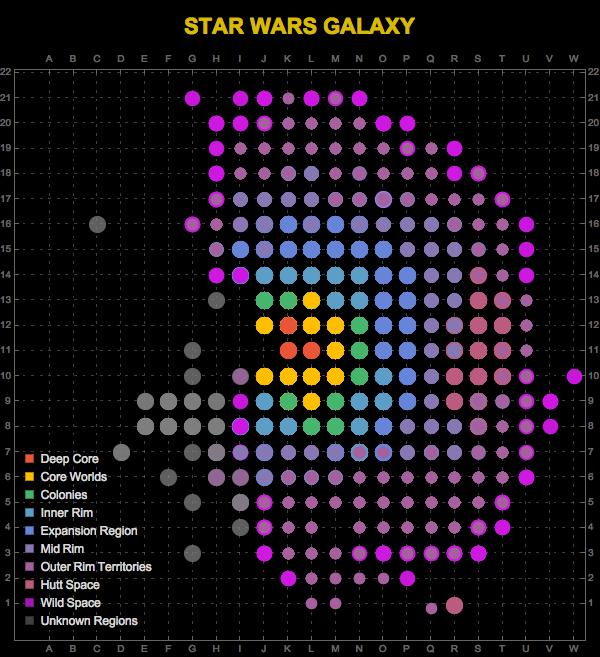
The galactic disk spans over 100,000 light years in diameter. If you want to know more about the galaxy I recommend you to visit the famous Wookieepedia page. I plan to do another post about the planets of Star Wars, but until then...
May the force be with you!
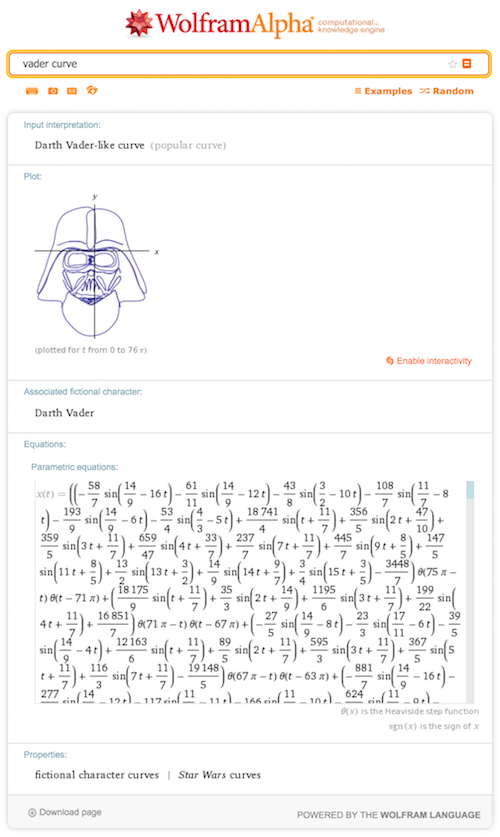
PS: Don't forget that you can obtain the curves of the main characters of Star Wars via Wolfram|Alpha.
