Today is the 151st birth anniversary of Wilbur Lincoln Scoville, who is best known for his Scoville Organoleptic Test that is used to measure hotness of peppers. Born in Bridgeport Connecticut on January 22nd, 1865, Wilbur Lincoln Scoville was a chemist, award-winning researcher, professor of pharmacology and the second vice-chairman of the American Pharmaceutical Association.
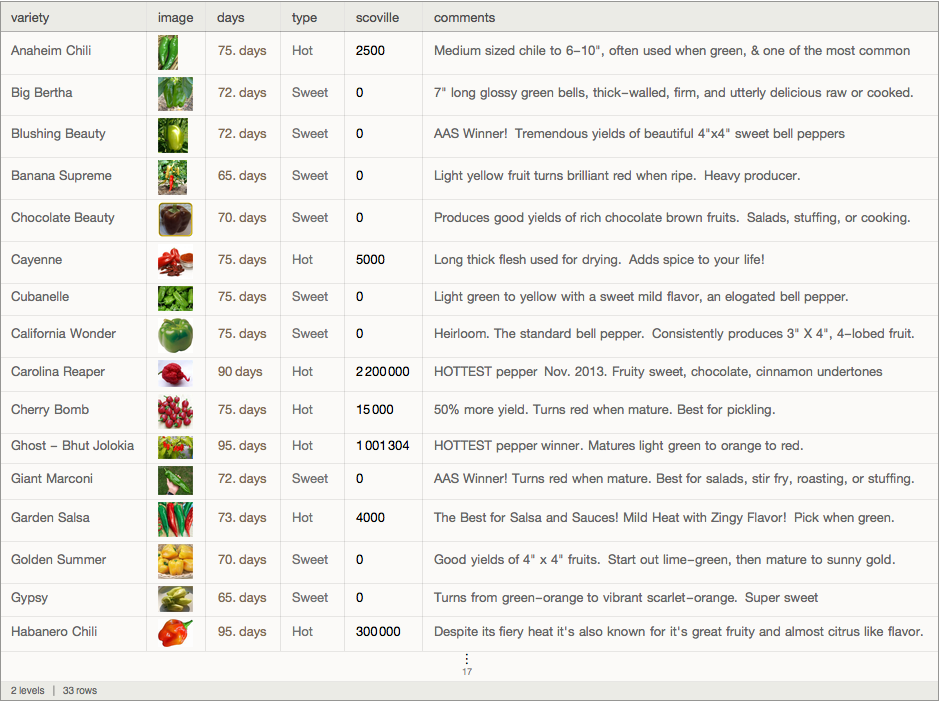
First, I generated a dataset of peppers from an excel file available at Meadow view growers website, the images were obtained using BingSearch which connect to the Bing Search API with the Wolfram Language.
bs = ServiceConnect["BingSearch"];
ServiceExecute["BingSearch","Search",{"Query"->" pepper","SearchType"->"Images","MaxItems"->1,"Elements"->"Thumbnails"}]
peppers =
 Dataset[<|"variety" -> First[#],
     "image" ->
      ImageResize[First@ServiceExecute["BingSearch",
        "Search", {"Query" -> First[#] <> " pepper",
         "SearchType" -> "Images", "MaxItems" -> 3,
         "Elements" -> "Thumbnails"}],100],
     "days" ->
      Quantity[
       If[StringQ[Part[#, 2]], Last@StringSplit[Part[#, 2], "-"],
        Part[#, 2]], "days"], "type" -> Part[#, 3],
     "scoville" ->
      Interpreter["Integer"][Last@Quiet@StringSplit[Part[#, 4], "-"]],
      "comments" -> Last[#]|> & /@
   Import["http://www.meadowview.com/wp-content/uploads/2012/08/\
PepperChart.xls"][[1, 3 ;; 35]]]
Finally, I visualize the Scoville scale of the peppers using a ListLogPlot:
ListLogPlot[
 MapThread[
  Tooltip[# + 1, TableForm[#2]] &, {Normal[peppers[All, "scoville"]],
   MapThread[{Style[#1, Bold, 16, Red],
      Style[#2 "Scoville Heat Units (SHU)", Bold], #3} &, {Normal[
      peppers[All, "variety"]], Normal[peppers[All, "scoville"]],
     Normal[peppers[All, "image"]]}]}], ImageSize -> 800,
 PlotRange -> All, AxesLabel -> {None, "SHU"}, PlotMarkers -> Style["j", 34, Red, Bold],
 PlotRange -> All,
 PlotLabel ->
  Style["The Scoville Scale", 32, RGBColor[1, 0.05, 0, 0.85], Bold],
 Ticks -> {MapThread[{#1,
      Rotate[Style[#2 , FontSize -> 12], 85 Degree]} &, {Range[33],
     Normal[peppers[All, "variety"]]}], Automatic}]
Check out the notebook attached and the dataset peppers.m in order to explore the interactive visualization.
 Attachments:


